

Housing Market Intro and Summary
What happened in the housing market in June, 2024? The broadening weakness I described in my previous Housing Market Review continued and confirmed a spring selling season bust. The data in June delivered a picture of a sales slowdown accompanied by increasing affordability squeezes despite inventory increases.
- The stocks of home builders have rolled over and topped out. Prices rallied right into the middle of the spring selling season bust.
- Homebuilder sentiment, likely deflated from the spring selling season bust, declined deeper into negative territory. Sentiment is declining alongside consumer sentiment and looks topped out for this cycle.
- Single-family housing starts are slipping from the 1M threshold. Building permits look topped out.
- Sales of new single-family homes fell to a low for the year and underlined the spring selling season bust.
- After surging to a peak in February, existing home sales declined sequentially throughout the spring selling season bust. The median sales price still managed to hit all-time highs.
- California existing home sales returned to the downtrend even as prices hit all-time highs thanks to homes priced over $1M.
- Strong growth for mortgage applications for new homes provides a solitary counterpoint to the spring selling season bust.
Housing Stocks
The iShares US Home Construction ETF (ITB) lost 4.8% for the month of June as its recent underperformance against the S&P 500 (SPY) continues. The S&P 500 gained 3.5% in June. This divergence punctuates the end of the seasonally strong period for home builders. The season’s end has whittled ITB nearly flat for the year: ITB is now down 0.7% for the year versus the S&P 500’s 14.5% gain. This divergence is also part of the larger divergence in the stock market between big cap tech stocks and the rest of the stock market. With no clear economic catalysts in coming months, I expect ITB to at best remain trapped in its former trading range for months to come. A rate cut or two could spark a brief rally which I fully expect to get faded since a few cuts will barely impact the dynamics of the housing market.
On Seeking Alpha I went into more detail on my expectations for the next seasonal period in What A Model for Analyst Ratings On Homebuilders Suggests for the Next Seasonal Trade.
")
Most of the charts of the builders in my universe look like some version of ITB. This replication indicates a consolidation of stocks in this space as buyers and sellers take a break.
Housing Data
Home Builder Confidence: The Housing Market Index – June, 2024
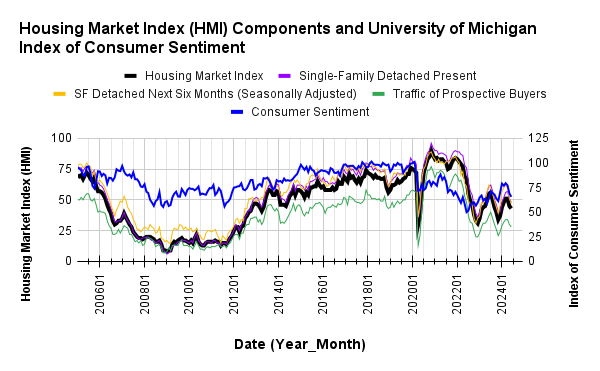
June’s drop in builder confidence essentially confirms a lasting top in the National Association of Home Builders (NAHB)/Wells Fargo Housing Market Index (HMI). The HMI dropped another two points to 43 for its second consecutive monthly decline. The HMI also hit its lowest point of the year after spending just two months in positive territory (50 and higher). According to the NAHB, elevated mortgage rates, financing costs, and input costs are all weighing on sentiment. All three HMI components fell to their lowest points of the year with Single-Family Detached Present tying January’s low level.
In the previous report, the NAHB complained that regulations are once again threatening to make housing more expensive. The NAHB once again complained about inflationary pressures. This time, the industry group lobbied for lower interest rates to motivate more construction that would in turn increase the supply of homes. Perhaps a rate cut or two absent recessionary pressures could revive confidence beyond the year’s highs.
/Wells Fargo Housing Market Index (HMI) and the University of Michigan Index of Consumer Sentiment")
Source for data: NAHB and the University of Michigan
All three components of the HMI remain well synchronized month-to-month.
Builders felt increased pressure to reduce prices in June. The 29% share of builders cutting prices is up from 25% in May. Still, the average price discount stayed flat at 6% for the twelfth straight month. The share of builders providing incentives increased from 59% in May to 61% in June, still below the year’s high at 62% in January.
The HMI experienced broadening weakness across regions in May. The picture was mixed for June. The South made a new low for the year, and the Midwest plunged from its high of the year. Meanwhile the Northeast reached toward its high of the year, and the West eked out a one point gain. The weakening sentiment in the South seems strong enough to keep a lid on the overall HMI for this cycle.
New Residential Construction (Single-Family Housing Starts) – May, 2024
Single-family housing starts fell to the lowest level of the year and hit below 1M for the first time since last October. My assumption that starts would stabilize around the 1M mark got a little more tenuous especially given sentiment declined again in June. For May, single-family housing starts decreased 5.2% month-over-month to 982,000, down from 1,036,000 (revised upward from 1,031,000). Right on schedule, the favorable year-over-year comparables ended in May with a 1.7% year-over-year decline in starts. For reference, April’s starts were up significantly by 18.3%.
![US. Bureau of the Census, Privately Owned Housing Starts: 1-Unit Structures [HOUST1F], first retrieved from FRED, Federal Reserve Bank of St. Louis, June 28, 2024](https://drduru.com/onetwentytwo/wp-content/uploads/2024/06/20240628_Housing-starts-May-2024.png "Housing starts")
A peaking in builder permits reinforces the peaking in housing starts and builder sentiment. Building permits in March ended an impressive 13-month streak of sequential gains with a 4.2% decline from February. April’s permits declined 0.7% from March. May’s permits declined 2.1%. These sequential declines also align with the broadening weakness in the housing market. The year-over-year gain moderated for the fourth month in a row. The year-over-year gain peaked in December at 36.9%. May was down to a +4.1% change. The current trajectory will flatten out the year-over-year change by July. It is increasingly clear that builders are at the their targeted inventory levels and are looking to bring it down a bit (a true reflection of demand expectations).
The West was the only region to maintain a year-over-year gain in starts. The West benefited from a very favorable comparable (starts in the West last year were very low) and a surprising jump from April starts. The Northeast, Midwest, South, and West each changed -3.3%, -19.4%, -3.5%, and +16.9% respectively year-over-year.
New Residential Sales (Single-Family) – May, 2024
May’s new home sales numbers officially underlined the 2024 spring selling season as a “bust”. April’s sequential surge edged past April 2023’s bump (after revisions), but May sales plunged off the April peak. May new home sales of 619,000 decreased 11.3% below April’s sales. April sales were significantly revised upward from 634,000 to 698,000. In telling fashion, sales decreased 16.5% year-over-year.
![US. Bureau of the Census, New One Family Houses Sold: United States [HSN1F], first retrieved from FRED, Federal Reserve Bank of St. Louis, June 28, 2024.](https://drduru.com/onetwentytwo/wp-content/uploads/2024/06/20240628_New-home-sales-May-2024.png "new home sales")
The median price held the year’s lows at $417,400, a decrease of 0.9% year-over-year. The year-over-year changes have essentially flattened out for the last several months.
A sharp shift in sales to homes priced near or above the median helped drive a sudden surge in price in March. In April, the sequential and year-over-year mix shifted toward the median. In May, the price distribution strongly favored the bottom two tiers with a 5 percentage point total gain year-over-year. I am still surprised by the notable swings in mix from month-to-month.
May’s inventory was 9.3 months of sales. This continues a steady uptrend over the last 4 or 5 months. For comparison, a year ago inventory sat at just 6.9 months of sales, closer to a balanced market. Absolute inventory in May decreased slightly from 483,00 to 481,000.
Revisions significantly impacted new home sales in the South. For May, sales in the region dropped back to recent lows. The Midwest was the only region to gain year-over-year. The other three regions suffered significant declines. The Northeast, Midwest, South, and the West changed -43.8%, +13.3%, -17.7%, and -20.9% respectively.
Existing Home Sales – May, 2024
Existing home sales still look like they will hold last year’s lows as a bottom despite the broadening weakness in the housing market. The decline since February’s peak demonstrates a busted spring selling season but at least the recent rate of decline is slowing.
The seasonally adjusted annualized sales in May of 4.11M declined 0.7% from April’s 4.14M (unrevised from 4.14M) while also decreasing 2.8% year-over-year. Like the market for new homes, the existing home sales market did not benefit from the spring selling season (or things might be even worse without spring’s revival of interest!).

(For historical data from 1999 to 2014, click here. For historical data from 2014 to 2018, click here) Source for chart: National Association of Realtors, Existing Home Sales© [EXHOSLUSM495S], retrieved from FRED, Federal Reserve Bank of St. Louis, June 28, 2024

The weakness in the sales of condos and coops may have flattened into bottoming process. The flat sales this year are cushioning the overall decline in existing home sales.
May’s absolute inventory of 1.28M homes was up 6.7% month-over-month and up 18.5% year-over-year. According to the NAR, “unsold inventory sits at a 3.7-month supply at the current sales pace, up from 3.5 months in April and 3.1 months in May 2023.” Once again, a large increase in inventory did not generate a similar jump in sales per the NAR’s longstanding hopes and claims. Still, the NAR looks forward to the positive impacts of more inventory: “Eventually, more inventory will help boost home sales and tame home price gains in the upcoming months.”
The persistent price run-up almost regardless of market conditions has weighed on the overall market. The median sales price of an existing home increased to an all-time high with a 3.1% month-over-month gain, a fourth sequential gain in a row. An increase of 5.8% year-over-year created the 10th straight year-over year gain. In its previous report, the NAR stated an expectation for price gains to slow with increasing inventory. That effect was completely absent in May.
The average time on market for an existing home fell to 24 days, down from 26 days in April, 33 days in March and 38 days in February. This average time was only 18 days a year ago, so the seasonal increase in buyers showed up but not as strongly as last year.
The share of sales to first-time home buyers rebounded from 26% in February to 32% in March and inched higher to 33% in April. The share retreated to 31% but was only 28% a year ago. I am still amazed the share is not lower given all-time highs in pricing. The NAR’s 2017 Profile of Home Buyers and Sellers reported an average of 34% for 2017, 33% for 2018, 33% for 2019, 31% for 2020, 34% for 2021, 26% for 2022, and 32% for 2023.
In January, the West was a surprising exception to the regional year-over-year declines in sales. All regions declined in February and March. The West was the sole gainer again in April and a gainer again in May. The South is the region dragging on the national numbers. The regional year-over-year changes were: Northeast -4.0%, Midwest +1.0%, South -5.1%, West +5.5%.
As usual, every region experienced a year-over-year price increase. The regional year-over-year price changes were again substantial for the Northeast: Northeast +9.2%, Midwest +6.4%, South +3.6%, West +5.5%.
Single-family existing home sales decreased 0.8% from April and declined on a yearly basis by 2.1%. The median price of $424,500 was up 5.7% year-over-year and up 3.3% month-over-month, the fourth sequential increase in a row.
California Existing Home Sales – May, 2024
California’s market for existing homes was a notable exception to the broadening weakness seen across the country in April. The state rejoined the national trends in May with distinct extremes between rural and urban counties.
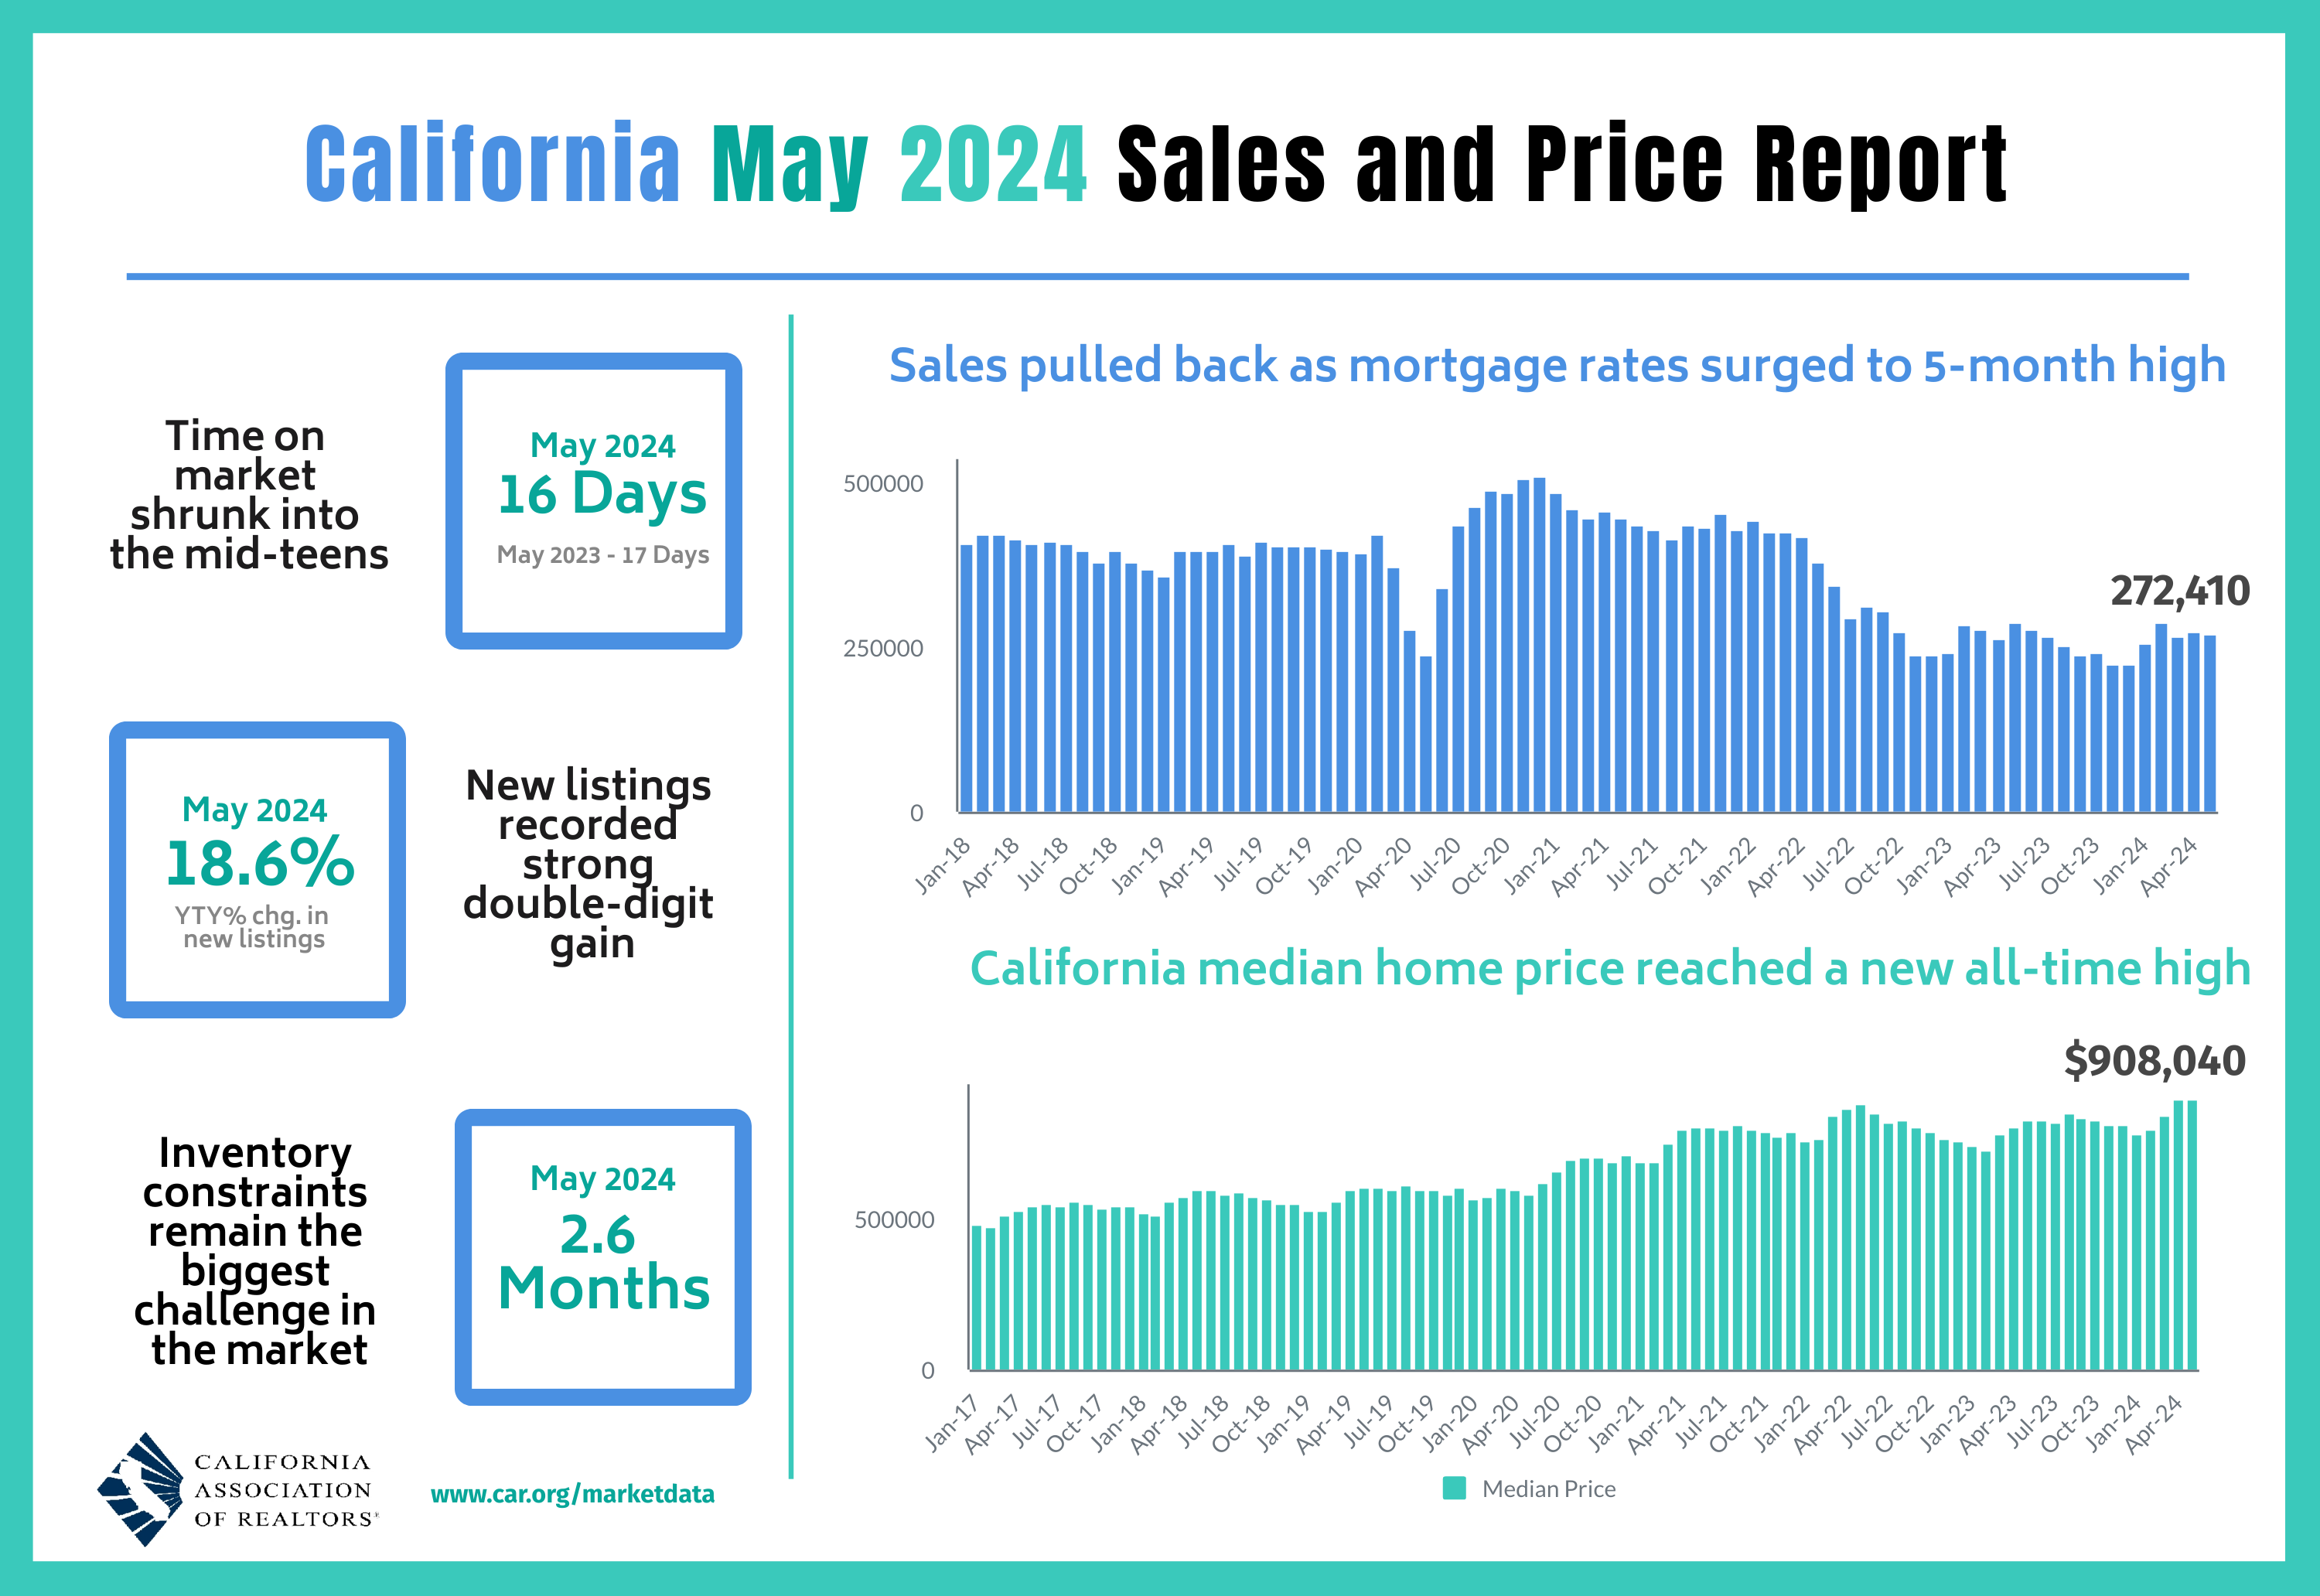
In March, California’s existing home market experienced a brief surge after 30 months of year-over-year declines, returning sales to September 2022 levels. April’s sales jump contrasted with that downtrend. May’s sales numbers returned to trend. According to the latest report from the California Association of Realtors (C.A.R.), existing single-family home sales totaled 272,410 in May, marking a 1.1% decrease from April and a 6.0% decrease from May, 2023.
As usual, sales declines did not impede price gains. Homes priced over $1M continue to drive California’s median price higher, both from affordability dynamics and inventory imbalances. According to CAR, “sales in the million-dollar-and-higher market segment rose 15.5 percent year-over-year in May, while sales in the sub-$500,000 segment declined by 12.2 percent. Sales of homes priced above a $1 million now make up 36.6 percent of all sales ― the biggest share in at least the last five years.” As a result, the median home price in May increased to another all-time high of $908,040, a gain of 0.4% from April and an 8.7% increase from the $835,280 median price in May, 2023.
This ongoing rise, marking the eleventh consecutive month of year-over-year gains, highlights the current strength in California’s higher-end market segments. For example, San Francisco and Los Angeles regions were the two Californian regions with double-digit year-over-year price gains. San Francisco was also just one of two regions with a year-over-year sales gain.
The median time it took to sell a home in California stayed flat at 16 days, a small decline from the 17 a year ago. This rapid turnover still significantly contrasts with the national numbers.
The statewide sales-price-to-list-price ratio was 100.0% for the fourth month in a row, also unchanged from 100.0% in May 2023. The price per square foot for an existing single-family home in California was $446 in May, a 9.6% surge from the $407 a year ago. This increase outpaced the overall median price trends.
The Unsold Inventory Index (UII) remained flat again at 2.6 months in May and up notably from 2.1 a year ago.
Home closing thoughts
The Marketplace Summary for the Spring Selling Season Bust
Marketplace declared good riddance to the spring housing market which perfectly described the spring selling season bust. However, the prospects for change in the next quarter or two are quite small. The affordability challenges, high mortgage rates, and low supply have become salient and enduring features of today’s housing market. The Marketplace segment referenced industry insiders who predict that the housing market will continue to struggle, with sales remaining subdued unless there is a substantial decrease in mortgage rates or an increase in housing inventory. The overall outlook suggests a challenging environment for both buyers and sellers in the coming months.
Housing Market “Stuck” for the Next Two Years?
From bust to stagnation. CNBC recently reported on a Bank of America analysis that claimed the housing market will be “stuck” until 2026. Bank of America predicted an extended period of stagnation for the housing market, driven by high interest rates, reduced affordability, and the lock-in effect where existing homeowners choose to stay put instead of moving into a higher mortgage rate. These drivers are all familiar narratives. Bank of America pointed to potential upside from demographic shifts favoring purchases from millennials.
Rents May Soon Add to Inflationary Pressures
Declining rents for new leases was supposed to remove one of the last pillars of inflationary pressures. Unfortunately, there are signs rent could soon trend higher again. Redfin (RDFN) reported that asking rents rose sequentially for the second month in a row following an 11-month downtrend. The 0.9% and 0.8% year-over-year increases for April and May are still well below the overall inflation rate and well below the 2% targeted by the Federal Reserve. Still, the upticks warrant concern especially if rents are rising because of more demand from people who would have otherwise bought a home. The duality of unaffordable homes and unaffordable rent puts tremendous pressure on households. Rents rose steeply from 2021 to 2022, so households feel lingering burdens. From Redfin:
“Demand from young renters remains high, as many of them are opting to stay put rather than contend with an increasingly unaffordable homebuying market…But so far, rent price growth has been limited because there are enough new apartments to meet demand, even in the busiest time of year for the rental market.”
Spotlight on Mortgage Rates
The Mortgage Bankers Association (MBA) reported three weekly increases and one weekly decrease in mortgage applications in June, the same trends as in May. In May, new home mortgage purchase applications surged 13.8% year-over-year. Given the sluggish new home sales in recent months, this surge in applications suggests new home sales should at least hang around the 1M mark for now. The strength in applications can cause the MBA to overestimate sales of new single-family homes. For example, for May, the MBA estimated 702,000 for May. The actual was 619,000 (pending future revisions of course – the revision for April was substantially higher). Applications gained 1% month-over-month (not seasonally adjusted). The year-over-year increase was the 16th consecutive month of gains and contrasts with the indicators confirming a softening housing market, including the spring selling season bust.
Mortgage rates declined ever so slightly in June, not likely enough to spark a fresh interest in buying homes and perhaps just enough to motivate people to wait for future rate declines.
![Freddie Mac, 30-Year Fixed Rate Mortgage Average in the United States [MORTGAGE30US], retrieved from FRED, Federal Reserve Bank of St. Louis; June 29, 2024.](https://drduru.com/onetwentytwo/wp-content/uploads/2024/06/20240629_30-Year-Fixed-Rate-Mortgage-Average-in-the-United-States.png)
Be careful out there!
Full disclosure: long ITB shares