Stock Market Commentary:
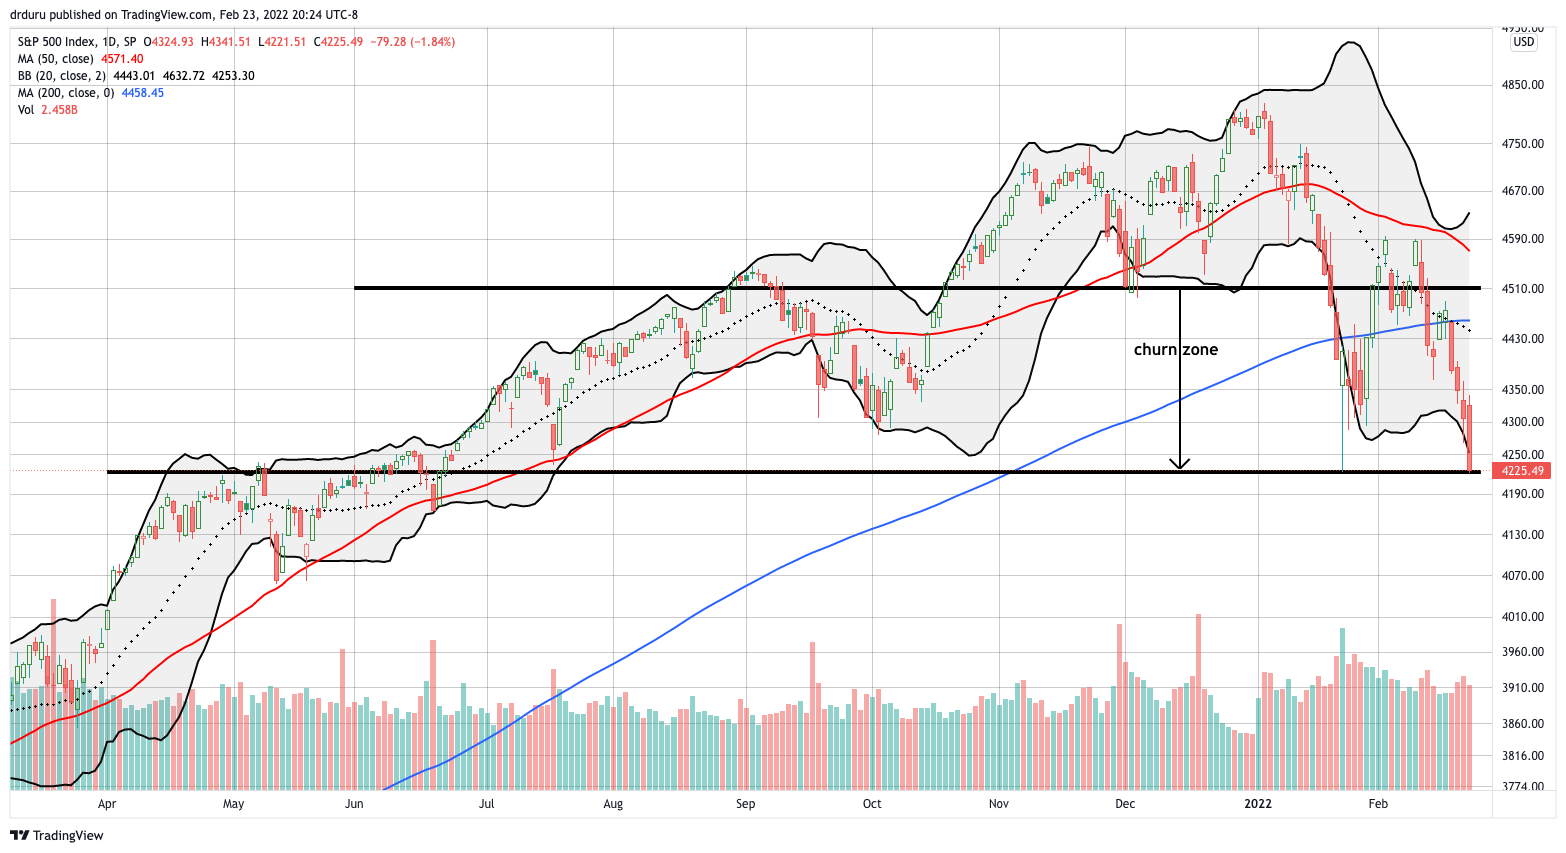
A divergence still exists between the anxiety in financial markets and market breadth, but that divergence is no longer so promising. Sellers rushed into the close as rumblings rolled of an escalation in the Ukraine-Russia conflict. After Putin followed through with a nighttime strike against Ukraine, stock market futures sold off sharply. Now the bull market stares down a major test instead of just a last stand in the churn zones for the S&P 500 and the NASDAQ and a new trading range for the iShares Russell 2000 ETF. The market faces brewing oversold conditions just as the churn zones face breakdowns.
The Stock Market Indices
The S&P 500 (SPY) lost 1.8% for the day and closed right on top of the lower boundary of its churn zone. The index also entered correction territory with a 10% loss from its all-time high set at the end of 2021. With the overnight geo-political and trading action, there is little need to contemplate the prospects for support to hold. Instead, the main question is how long will the breakdown last? Moreover, is it time to consider the prospects for the S&P 500 to eventually drop into an official bear market (a 20% loss from the all-time high)?

The NASDAQ (COMPQX) did the S&P 500 one better by closing slightly below its churn zone. The 2.6% loss took the tech-laden index to a 9-month low. Incredibly, the NASDAQ now only as a 1.1% gain since the end of 2020! Trading in the aftermath of the escalation of war will finish the complete reversal of the NADSAQ’s 2021 gains. I will wait to see how trading unfolds before drawing a lower churn zone for the NASDAQ with the March, 2021 lows as the next level of presumed support.
The iShares Russell 2000 ETF (IWM) lost 1.9% on the day. The index of small caps somehow managed to avoid setting a new low for the year. However, IWM is once again trading below where it ended the year in 2020.
Stock Market Volatility
The volatility index (VIX) made a surge into the close with a 7.7% gain. Surprisingly, the VIX did not set a new closing high for the year. The VIX of course is now set to challenge the intraday highs of the year.
The Short-Term Trading Call with A Promising Divergence
- AT50 (MMFI) = 27.0% of stocks are trading above their respective 50-day moving averages
- AT200 (MMTH) = 29.6% of stocks are trading above their respective 200-day moving averages
- Short-term Trading Call: bullish
AT50 (MMFI), the percentage of stocks trading above their respective 50DMAs, ended the day somehow above the 20% oversold threshold. Selling in the aftermath of the escalation of war should definitely punch my favorite technical indicator into oversold territory. For that reason alone, I am keeping the short-term trading call bullish. However, unlike other oversold episodes, I am content to wait a bit before resetting my trades in call options on the indices. With the presumed breakdown of the churn zones, I have a new overhead resistance to consider as the limit of upside for the market. In other words, I need to wait for the market’s close to determine my next step (I will post in the comments after the close).
In the meantime, I will likely take profits on my last hedge: a fistful of put options on the ARK Fintech Innovation ETF (ARKF). My calendar put spread on ARK Innovation ETF (ARKK) managed to hit its initial profit target during Monday’s trading (I have consistently under-estimated to speed and depth of ARKK’s on-going descent).
I continue to closely monitor currency markets for more accurate/real-time sentiment readings. As I noted earlier, short-term traders should watch currencies not stocks when geo-political tensions rise. At the time of writing, AUD/JPY in particular continues to surprise me with its resiliency. The indicator of risk sentiment sold-off, but at the time of writing it trades at the bottom of its recent range (I reflexively refreshed my trade on this range). Perhaps the prospects of higher commodity costs from the war in Ukraine is boosting the Australian dollar.
Be careful out there!
Footnotes
“Above the 50” (AT50) uses the percentage of stocks trading above their respective 50-day moving averages (DMAs) to measure breadth in the stock market. Breadth defines the distribution of participation in a rally or sell-off. As a result, AT50 identifies extremes in market sentiment that are likely to reverse. Above the 50 is my alternative name for “MMFI” which is a symbol TradingView.com and other chart vendors use for this breadth indicator. Learn more about AT50 on my Market Breadth Resource Page. AT200, or MMTH, measures the percentage of stocks trading above their respective 200DMAs.
Active AT50 (MMFI) periods: Day #467 over 20%, Day #1 under 30% (underperiod ending 12 days over 30%), Day #4 under 40% (underperiod), Day #34 under 50%, Day #67 under 60%, Day #247 under 70%
Source for charts unless otherwise noted: TradingView.com
Full disclosure: long QQQ call spreads, long IWM call spread, long SPY call spread, long ARKF puts, long SPY, long AUD/JPY
FOLLOW Dr. Duru’s commentary on financial markets via StockTwits, Twitter, and even Instagram!
*Charting notes: Stock prices are not adjusted for dividends. Candlestick charts use hollow bodies: open candles indicate a close higher than the open, filled candles indicate an open higher than the close.

I forgot to mention that the ONE thing I would do today is buy SVXY on a VIX surge. I’m in now.
SVXY ended up being my only buy for the day despite the market’s surge. The S&P 500 and the NASDAQ dropped well below the bottom of the churn zones but returned inside. I am now an active buyer again as long as the bottom of the churn zone holds.