Stock Market Commentary
Investor psychology took an important hit this week. During the Goldman Sachs (GS) Q&A period for the Q4 2021 earnings conference call, Chairman and CEO David Solomon dropped an inflation bomb. Solomon claimed that “there is real wage inflation everywhere in the economy, everywhere” (from the Seeking Alpha transcript). Solomon responded to an analyst who wondered whether Goldman was just playing catch-up from a year of holding the line on wages. GS dropped 7.0% that day and another 2.0% today. Goldman symbolizes an expanding portrait of inflation filtering into the U.S. economy. Not only does this news further support Fed tightening, but also this news agitates and alarms a Wall Street that hates sharing corporate profits with salaries. In other words, the inflation-related catalysts weighing on the stock market look set to continue for some time.
The Stock Market Indices
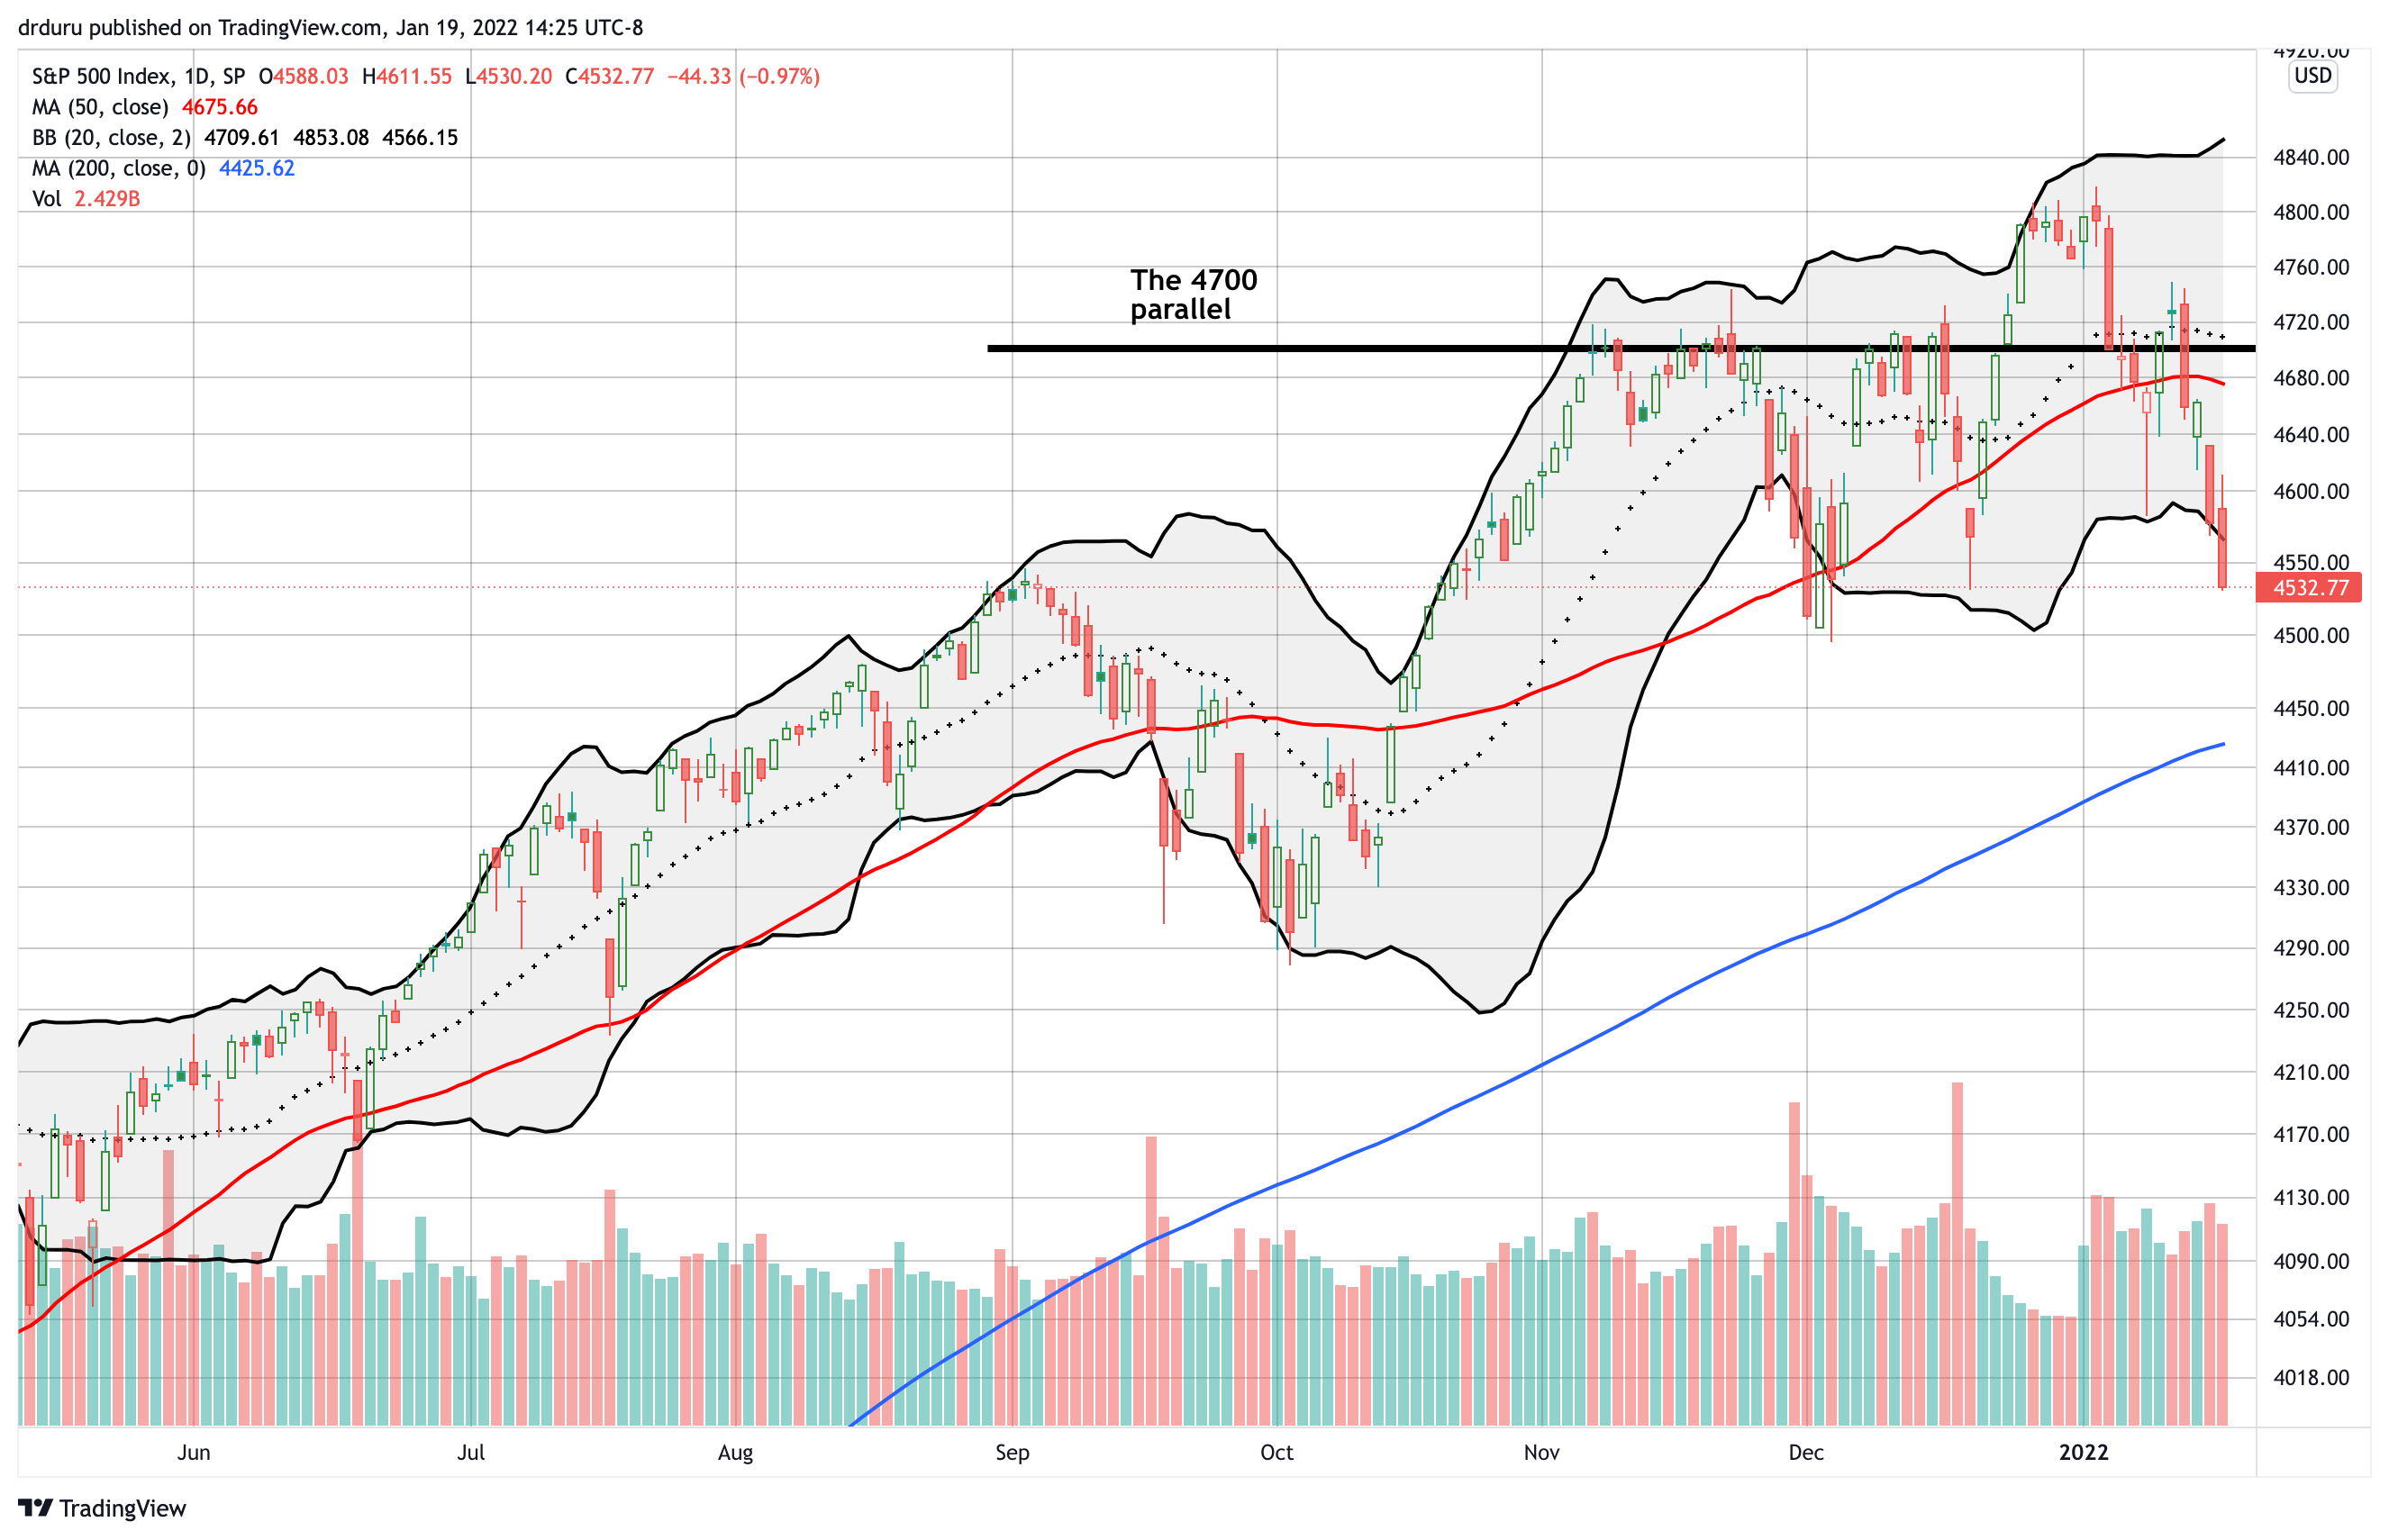
The S&P 500 (SPY) looks like it hit a wall at what I am calling the “4700 parallel.” The name is a handy shorthand until the technicals no longer support the importance of this line. With the index confirming a 50DMA breakdown and closing at the December lows, the Santa Revenge rebound looks like a clear false breakout.
Of course, ever since the pandemic began, the S&P 500 has exhibited some very predictable patterns. The 1.0% loss is testing a Bollinger Band (BB) pattern related to the reliable support and now pivot from the 50-day moving average (DMA) (the red line below): sellers have failed over and over to sustain selling pressure beyond an extension below the lower-BB.

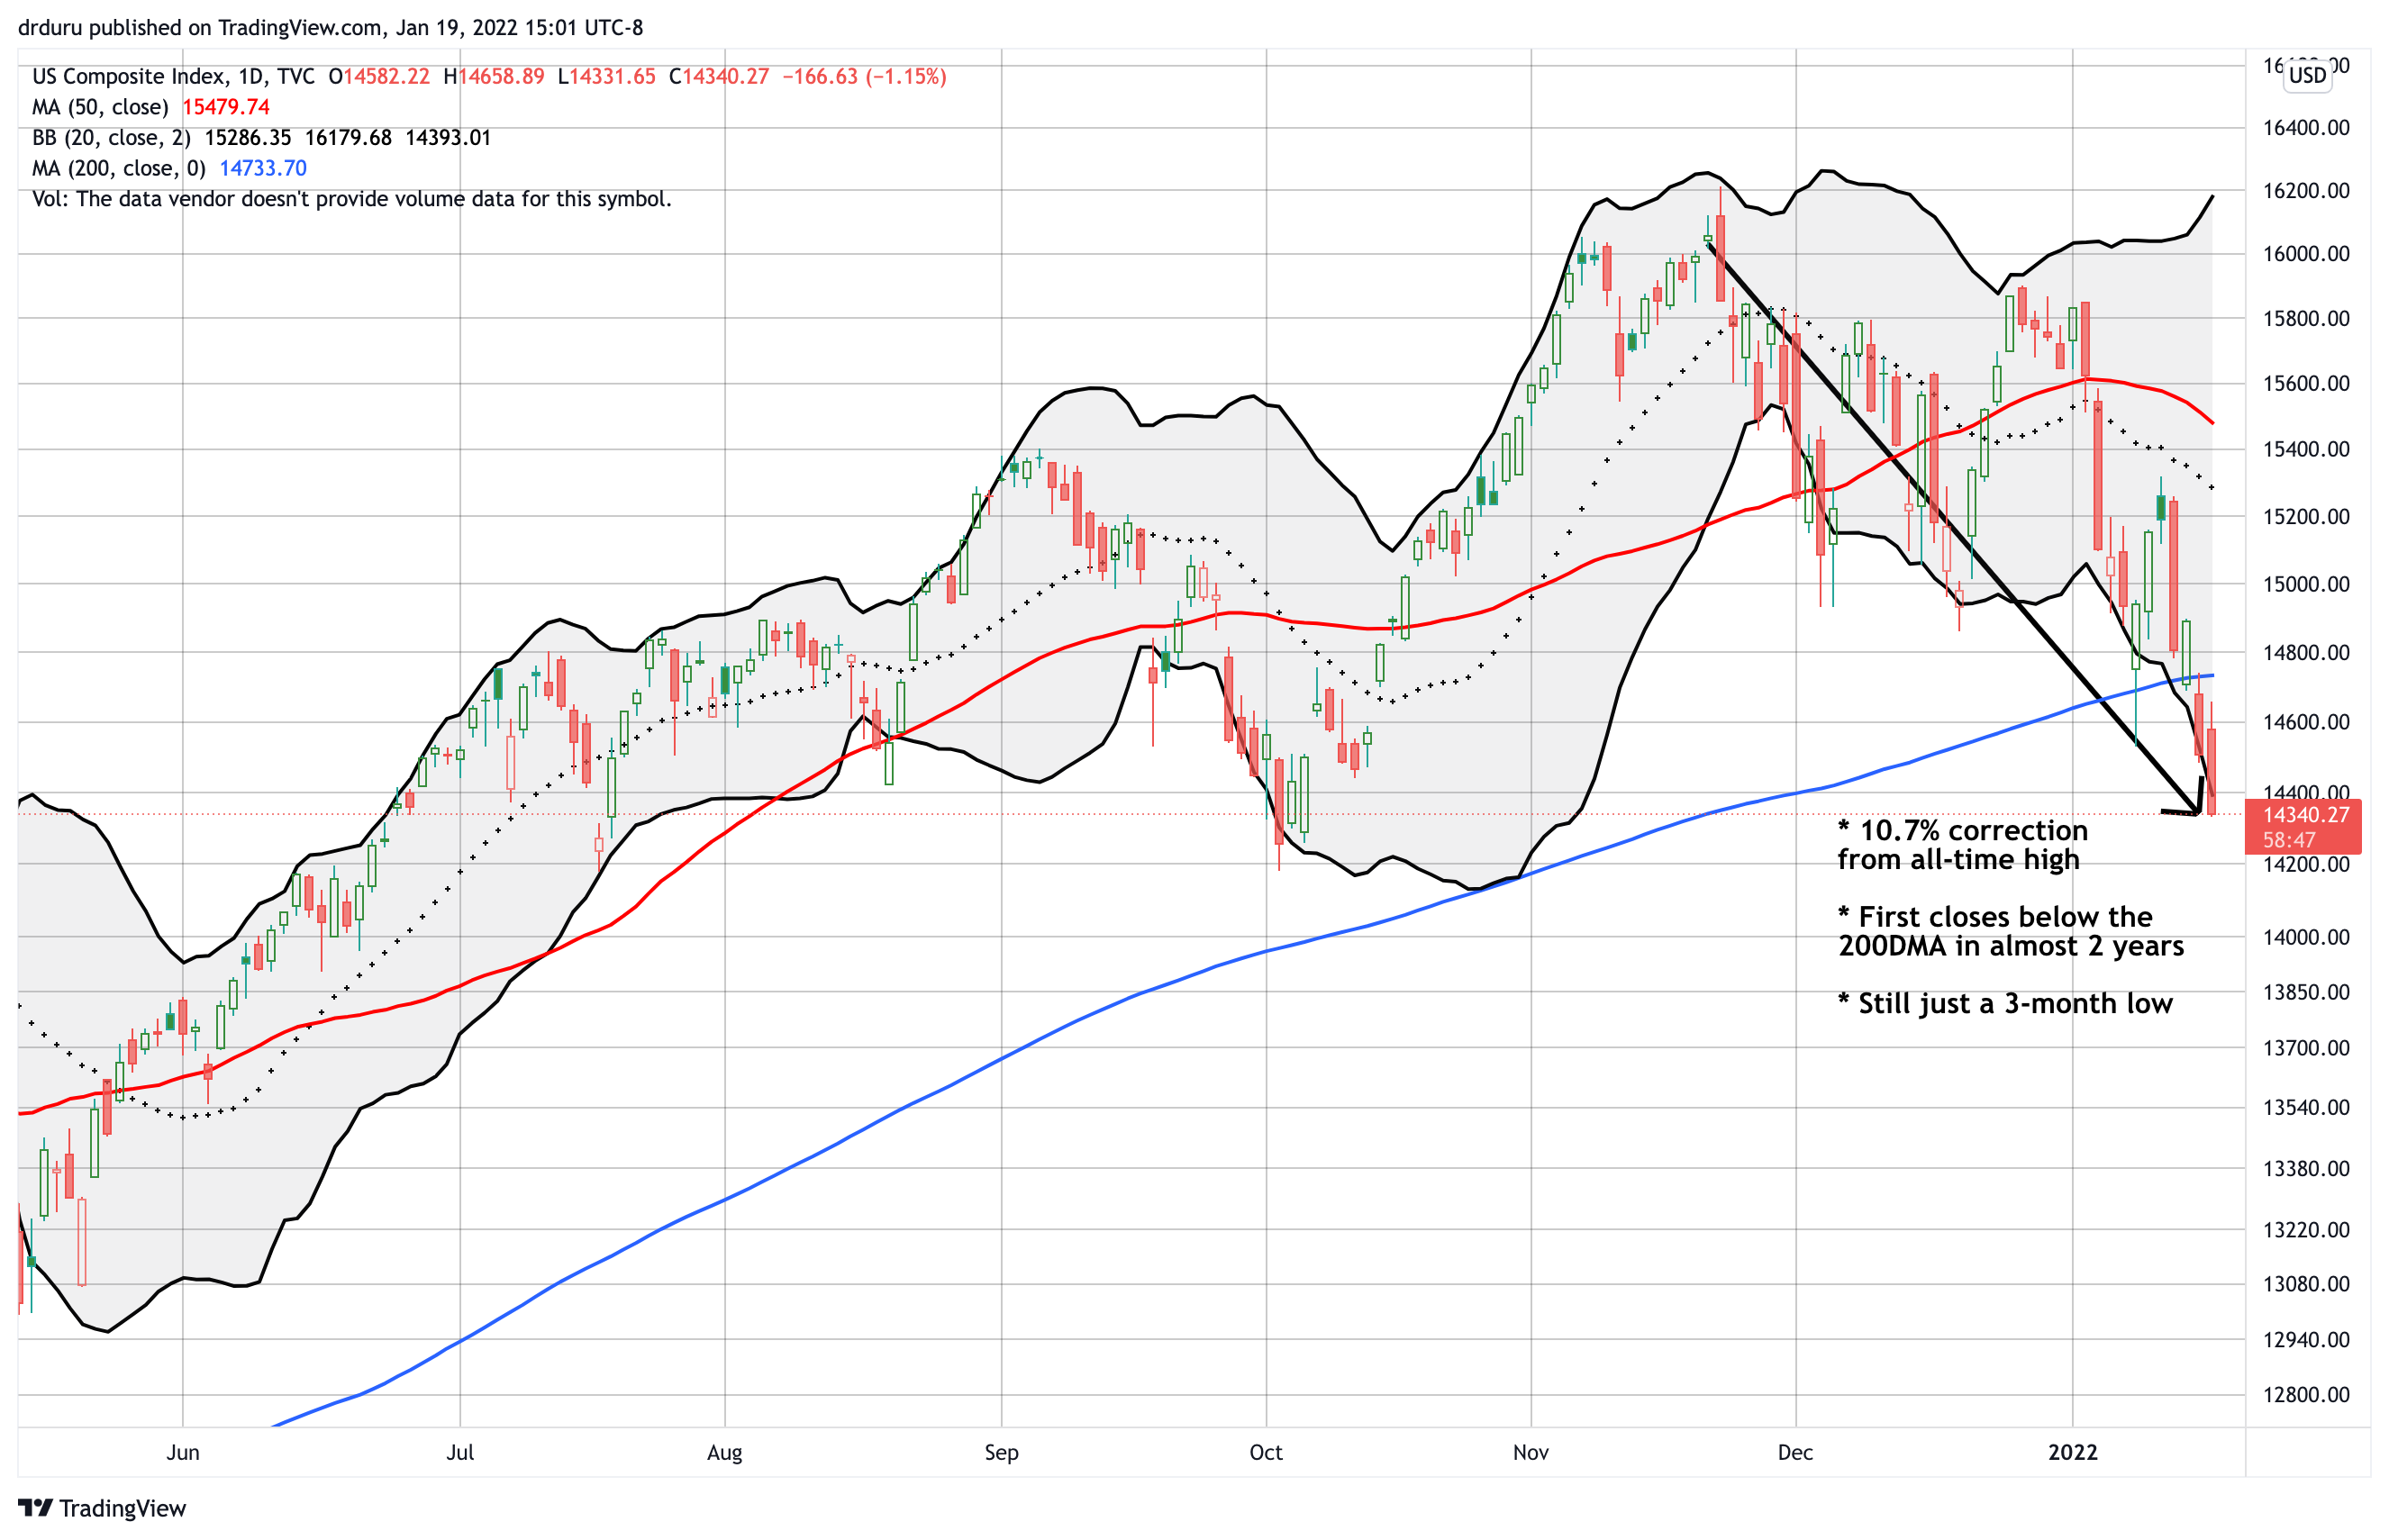
The NASDAQ (COMPQX) officially entered correction territory with a 10%+ pullback from the all-time high. Last week, the algos and likeminded buyers could not wait for a close in correction territory. This time, the algos sat back and let sellers have their way. Yet, I jumped into a speculative QQQ $375/$382 call spread expiring next week. QQQ lost 1.1% on the day and closed at $366. QQQ also stopped just short of testing its 200DMA resistance. The tech-laden ETF closed at $380 just last Friday.
The NASDAQ nearly tested double support from the July and October lows. A further breakdown puts a full-blown 20% correction and bear market into play for the tech-laden index.

The iShares Russell 2000 ETF (IWM) finally gave up the ghost. IWM broke down after a year holding a trading range from about $209 to $234. The ETF of small caps lost 3.0% on Tuesday and another 1.6% today. IWM last saw these prices on January 6, 2021. With the extension below the lower-BB, I decided to nibble on IWM $215 calls expiring next week. These calls are a speculative bet on a relief rally toward 20DMA resistance (the dotted line below).
Stock Market Volatility
The volatility index (VIX) is no longer churning. The decisive selling the past two days enabled the VIX to close above the critical 20 level two straight days. This achievement starts a kind of clock for the VIX. The chart below includes a black horizontal line that marks the 20 level. Note how starting in April of last year, the VIX tended to spend its time below 20. The balance looks like it shifted starting with the December surge. In other words, elevated volatility may soon become the norm for the VIX.
The Short-Term Trading Call with An Inflation Bomb
- AT50 (MMFI) = 32.9% of stocks are trading above their respective 50-day moving averages
- AT200 (MMTH) = 38.2% of stocks are trading above their respective 200-day moving averages
- Short-term Trading Call: neutral
AT50 (MMFI), the percentage of stocks trading above their respective 50DMAs, ended the first two weeks of the year around 42%. In just two days, AT50 dropped into the “close enough to oversold” range for bull markets. The potential for a relief rally from here helped drive me to speculate on QQQ and IWM call options plays. However, the short-term trading call remains firmly planted on neutral. I still do not like the tenor of this market, and I want to see a flush to true oversold trading levels (AT50 below 20%) to get bullish.
The fresh deterioration in AT200 keeps me wary. At 38.2%, AT200 is right back to the recent lows. In fact, today was only the fourth lowest close in the last 20 months. AT200 could (should?) keep trending downward until AT50 pulls off an oversold performance.
I also took profits on my latest put option on the ARK Innovation ETF (ARKK). I explained more of my approach in “Cathie Wood: A Doozy of A Correction.”
Be careful out there!
Footnotes
“Above the 50” (AT50) uses the percentage of stocks trading above their respective 50-day moving averages (DMAs) to measure breadth in the stock market. Breadth defines the distribution of participation in a rally or sell-off. As a result, AT50 identifies extremes in market sentiment that are likely to reverse. Above the 50 is my alternative name for “MMFI” which is a symbol TradingView.com and other chart vendors use for this breadth indicator. Learn more about AT50 on my Market Breadth Resource Page. AT200, or MMTH, measures the percentage of stocks trading above their respective 200DMAs.
Active AT50 (MMFI) periods: Day #443 over 20%, Day #19 over 30% (overperiod), Day #2 under 40% (underperiod), Day #10 under 50%, Day #43 under 60%, Day #223 under 70%
Source for charts unless otherwise noted: TradingView.com
Full disclosure: long QQQ call spread, long IWM calls
FOLLOW Dr. Duru’s commentary on financial markets via StockTwits, Twitter, and even Instagram!
*Charting notes: Stock prices are not adjusted for dividends. Candlestick charts use hollow bodies: open candles indicate a close higher than the open, filled candles indicate an open higher than the close.
