
Stock Market Commentary
The week began with two straight days of selling for the stock market. Almost everything was in place for a real pullback. Although the S&P 500 (SPY) was less than 2% off its all-time high, my favorite measure of breadth in the stock market, AT40 (T2108), the percentage of stocks trading above their respective 40DMAs, plunged and reconfirmed resistance at its steepest downtrend line. At the time, I pointed out the tension between the combination of a bearish confirmation versus a potentially bullish overreach by sellers. The buyers snapped back and won the battle. Stock buyers rallied the stock market two of the next three days. Still, they failed to crack the important downtrend that looms over AT40. That downtrend, and a less steep one over that, keep me skeptical about the health of the current rally.
The Stock Market Indices
The S&P 500 (SPY) ended the week with a 1.1% gain on Friday. At one point, the index challenged its all-time high as if to tease anyone who went short the market last week. While short-term bearish bets should stop out at a higher close, I will maintain my SPY puts. If the rally continues higher from here, those put options stay in place as hedges to trade against.
The NASDAQ (COMPQX) churned like the S&P 500, but it gained a slight upward bias. The tech-laden index stopped just short of the previous week’s closing high. The all-time high is just around the corner from that point.
The spotlight shines brightest on the iShares Trust Russell 2000 Index ETF (IWM). A pivot around the 50-day moving average (DMA) since late March is swinging the outlook from bearish to bullish and back again. The 1.9% gain on Friday brought the index of small caps close to a breakout. I am a buyer on a higher close. I am more tentative after my bullish expectations for last week fizzled out with a quickness.
Stock Market Volatility
The volatility index (VIX) jumped on Monday and churned from there. The VIX teased the 20 level twice in the middle of its churn. The multiple failures suggest weakness, but I see nothing actionable until a fresh breakdown. After this churn, a breakout above 20 would fire off a bright red warning sign for the market.
The Short-Term Trading Call after buyers snapped back
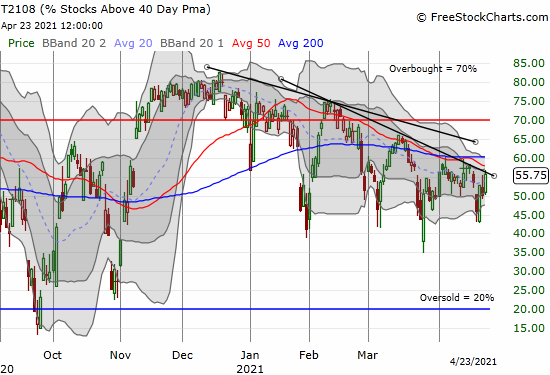
- AT40 (T2108) = 55.8% of stocks are trading above their respective 40-day moving averages
- AT200 (T2107) = 82.4% of stocks are trading above their respective 200-day moving averages (TradingView’s calculation)
- Short-term Trading Call: neutral
AT40 (T2108), the percentage of stocks trading above their respective 40DMAs, finished the week lower than its close from the previous week. The chart below shows two downtrends. The steepest downtrend is the primary trend. After last week started with a confirmation of that downtrend, I downgraded my short-term trading call to neutral. I am comfortable staying neutral given a secondary downtrend awaits a breakout from the primary one. A pullback from that secondary downtrend will be sufficient to flip me to (cautiously) bearish. Regardless, the specific trigger for getting bearish the entire stock market remains tricky. Individual stocks are easier to gauge at this point.
Stock Chart Video Reviews
Stock Chart Reviews – Below the 50DMA
Micron (MU)
I was hopeful in late February that Micron (MU) could tag the $100 price level. Instead, MU only churned its way to today. The path to nowhere includes a 4.8% post-earnings gain that sellers slowly erased. Now, MU faces the bearish implications of a confirmed 50DMA breakdown. Like so many stocks, MU is a short if it closes below its March low.
Peloton Interactive (PTON)
Safety issues took down Peloton (PTON) last week. After a confirmed 200DMA breakdown, PTON gapped down one more time and stabilized. A lower close makes the stock a fresh short. Buyers have a lot of work ahead to reverse the bearish breakdown below a converging 50 and 200DMA. I hesitated to watch the video from the U.S. Consumer Product Safety Commission, but I decided to do so for a better understanding of the issue. I was left wondering why the agency did not first warn parents and guardians against leaving small children unattended near (any) running machinery.
Netflix (NFLX)
In last week’s earnings conference call, Chief Financial Officer Spence Neumann explained the latest subscriber dynamics for Netflix (NFLX):
“…we had this huge pull forward in 2020 in terms of our subscriber additions, nearly 40 million paid net adds in 2020….
…the key is the business remains healthy. Our engagement, our viewing per household was up year-over-year in Q1. Our churn was down year-over-year and the business is still growing….even at 4 million paid net adds if you kind of take COVID out and look over the past 2 years, we have grown from 2 years ago at about 150 million members to almost 210 million now. So that’s nearly 40% growth and about just under 20% over an average over each of those 2 years, which is in line with the past couple of years. So, the business remains healthy and that’s because the long-term drivers this big transition from linear to streaming entertainment and that remains as healthy as ever. But you do see little kind of noise in the near-term, but a lot of long-term priority.”
Netflix, Inc. (NFLX) Q1 2021 Results – Earnings Call Transcript
These reassurances were not good enough for traders and investors. NFLX gapped down below its 200DMA the next day for a 7.4% loss. The soaring optimism from just three months ago looks long gone as NFLX returns right back into its now 9-month trading range. NFLX is a tricky trade and perhaps best just left alone until this trading range resolves itself to the upside or downside. January’s post-earnings surge was a huge fakeout. I also suspect that a break of the March low will just get bought by traders playing the range.
Roku (ROKU)
For a brief moment, the selling in NFLX hit Roku (ROKU). The stock gapped below its 20DMA (the dotted line below), and buyers stepped in from there. Sellers got their mini-revenge the next day on a fade. Now, tension builds with the convergence of the downtrending 50DMA and uptrending 20DMA.
JPMorgan & Chase Co (JPM)
JPMorgan & Chase Co (JPM) slipped below its 50DMA last week. The potential trouble looks small and subtle. Still, the confirmed breakdown caught my attention given it follows what should have been a bullish consolidation period. A 1.9% post-earnings drop got the sellers a little more active.
Nordstrom (JWN)
I keep checking on Nordstrom (JWN). Like so many stocks that avoided March’s growth tantrum, JWN is trapped in an extended trading range. The mid-March surge was a big fakeout. If that move exhausted buyers, then a breakdown from the trading range could trigger a steep sell-off. Either way, I am continuing to look for the next trading opportunity in JWN.
Lithium Americas Corp (LAC)
I have been waiting and waiting for Lithium Americas Corp (LAC) to test 200DMA support. LAC got close enough last week for me to buy a first tranche of shares. Note that LAC is not yet flashing a bottom. A close above the downtrending 20DMA would be a good sign. A downtrending 50DMA still looms overhead.
Virgin Galactic Holdings (SPCE)
The downtrend resumed on Virgin Galactic Holdings (SPCE). All the excitement from late last year is gone. Despite the confirmed 200DMA breakdown, I sold a weekly $23 put option. That option expired in the money on Friday. I now own shares at an ever so slight discount. This position is a hold waiting for the next rally.
Stock Chart Reviews – Above the 50DMA
Conns (CONN)
I often forget about electronics retailer Conns (CONN). I have yet to see a store and marvel that the company remains in competition with the likes of Best Buy (BBY) and Amazon.com (AMZN). CONN surged 24.3% post-earnings at the end of March. The subsequent rally faded quickly. The stock is a buy on a close above the 20DMA. Otherwise, I am waiting to see what happens on a test of 50DMA support.
Snap Inc (SNAP)
Traders were clearly unsure how to trade Snap (SNAP) post-earnings. The stock gapped up, levitated, faded to a near close of the gap, and finished with a healthy 7.5% gain. SNAP is in no-man’s land until it breaks out above the high from the previous week (bullish) or breaks down below last week’s low (bearish).
Be careful out there!
Footnotes
“Above the 40” (AT40) uses the percentage of stocks trading above their respective 40-day moving averages (DMAs) to measure breadth in he stock market. Breadth indicates the distribution of participation in a rally or sell-off. As a result, AT40 can identify extremes in market sentiment that are likely to reverse. Above the 40 is my alternative name for “T2108” which was created by Worden. Learn more about T2108 on my T2108 Resource Page. AT200, or T2107, measures the percentage of stocks trading above their respective 200DMAs.
Active AT40 (T2108) periods: Day #126 over 20%, Day #110 above 30%, Day #108 over 40%, Day #3 over 50% (overperiod), Day #20 under 60% (underperiod), Day #39 under 70%


Black line: AT40 (T2108) (% measured on the right)
Red line: Overbought threshold (70%); Blue line: Oversold threshold (20%). Source: FreestockCharts
Source for charts unless otherwise noted: TradingView.com
Grammar checked by Grammar Coach from Thesaurus.com
Full disclosure: long UVXY calls, long SPY puts, long SPCE
FOLLOW Dr. Duru’s commentary on financial markets via StockTwits, Twitter, and even Instagram!
*Charting notes: Stock prices are not adjusted for dividends. Candlestick charts use hollow bodies: open candles indicate a close higher than the open, filled candles indicate an open higher than the close.
Thank you for drawing trend lines on the T2108 chart. I have been drawing them in my mind for years! I note that its current primary downtrend is similar in slope to the one that started in early August 2020 and broke in early November. However, I don’t think that pattern will repeat; last fall’s downtrend included two trips below 30%, while this one’s lows are in a slow uptrend and have never reached below 40%. Instead, if T2108 is currently forming a wedge, it should be possible to project a date by which it must resolve…?
The secondary downtrend should resolve by mid to late May if a breakout is on the way. The primary downtrend could of course resolve this week.
I agree a key difference between now and November is that the market went through an oversold period and an “almost” oversold period that washed out a lot of motivated sellers. Right now, there are just enough stocks holding up the major indices to give the veneer of strength.