
AT40 = 58.7% of stocks are trading above their respective 40-day moving averages (DMAs)
AT200 = 55.4% of stocks are trading above their respective 200DMAs
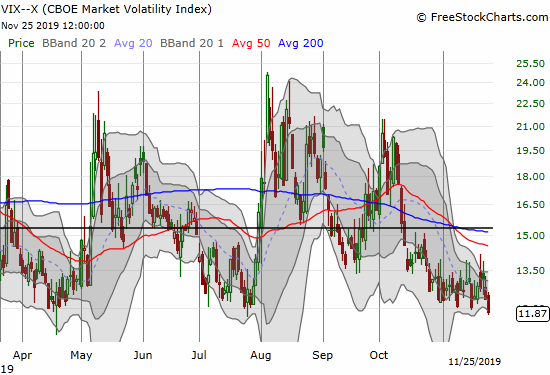
VIX = 11.9
Short-term Trading Call: neutral
Stock Market Commentary
If “cautiously neutral” made sense, I would make that description my short-term trading call.
Last week’s trading action motivated me to observe that the stock market is drifting higher “no matter what.” Today, the S&P 500 (SPY) put an exclamation point on the action with a 0.8% jump to a fresh all-time high.
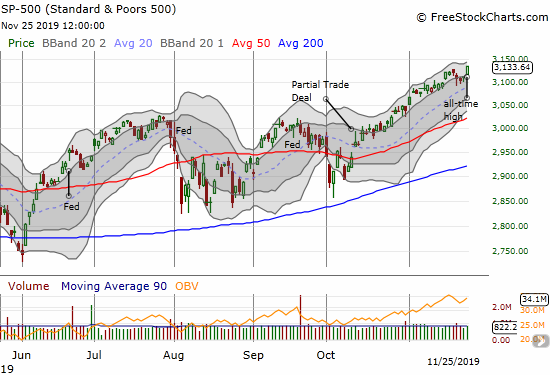
Unlike so many other recent strong days for the S&P 500, several other important signals supported today’s rally. Collectively, these signals represent what I think is a turn in momentum or sentiment that is quite consistent with a seasonally benign period for the stock market.
The Turn
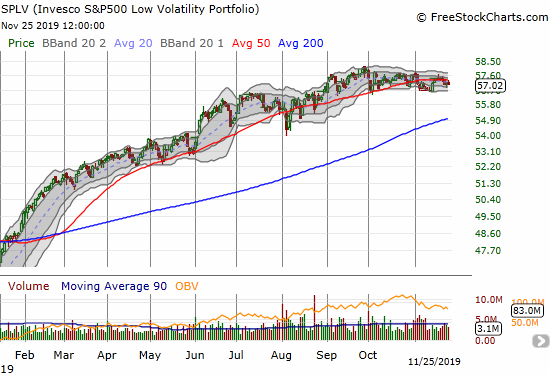
Two S&P 500 (SPY) indices provide a convenient view on the likely turn in sentiment. The Invesco S&P 500 Low Volatility ETF (SPLV) represents cautious bullishness: investors who want to buy “safe.” SPLV made its last high in September and has waned a bit since then.
The Invesco S&P 500 High Beta ETF (SPHB) is on the other side of the ledger as it represents the high beta, more speculative, higher growth names in the S&P 500. SPLV peaked in April and has swung widely since then while making no progress. Today, SPLV broke out to a near 14-month high (remember that number: 14) on a 1.8% gain.
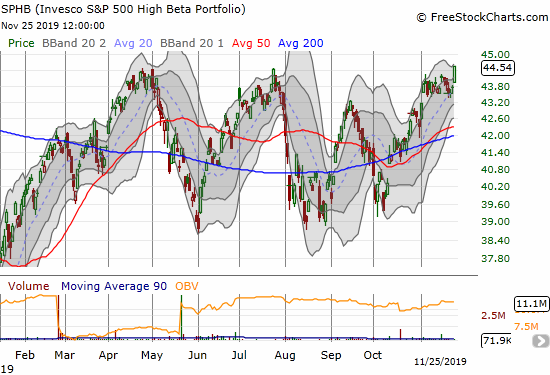
So on a relative basis, investors are suddenly much more interested in speculating than playing it safe. This kind of aggressively bullish sentiment is needed to keep powering the stock market higher from here.
Bearish Divergence Left Behind
Earlier I pointed out the mildness of the relief of bearish divergence in the stock market. AT40 (T2108), the percentage of stocks trading above their respective 40-day moving averages (DMAs), confirmed the end of bearish divergence by sharply rallying alongside the S&P 500. My favorite technical indicator jumped from 53.7% to 58.7%. Moreover, AT200 (T2107), the percentage of stocks trading above their respective 200DMAs also popped by moving from 52.7% to 55.4%. The conditions seem in place for the stock market to make a run for the AT40 overbought threshold of 70%.
Small Caps Turn Up and Wake Up
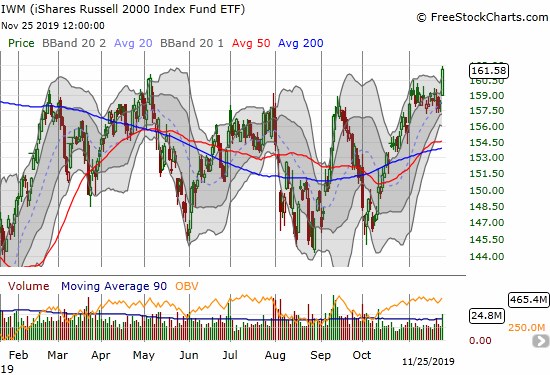
I should have known to make a 2-week instead of a 1-week play on call options for the iShares Russell 2000 Index Fund ETF (IWM). IWM left me in the dust with a picture-perfect 2.1% gain and breakout to a near 14-month high (there’s that number 14!). Small caps are generally more speculative than the bigger stocks in the S&P 500, so IWM’s out-performance is another confirmation of a more aggressively bullish turn in the stock market. Given my belief that an extended rally could be underway, I decided to chase IWM with a combination of call options and a calendar call spread…the long end expiring December 13th of course.
Volatility
In my last post, I claimed “if a strong rally and blow-off top is coming, a VIX break below 12 might provide a great confirming signal of what is to come.” The volatility index (VIX) wasted no time. The VIX fell 3.8% to a – you guessed it – near 14-month low. The complacency is now almost at the extremely low level that surprisingly has bullish implications. Unless the VIX turns right around here, then the fear gauge’s basket full of complacency has added another confirmation of the definitive turn in sentiment.
The Trading Call
So why not turn at least cautiously bullish with all the signs pointing ever upward? I hate churning my trading call, and I think conditions are still tenuous enough that I could be forced right back to neutral. For example, a close below Friday’s close would invalidate today’s breakout. Moreover, the S&P 500 has rallied nearly nonstop since the beginning of October. The price action alone is getting quite extended. A natural pullback might force me to churn a bullish trading call right back to neutral. I would rather look to get bullish on such a pullback. In the meantime, my trades will be heavily biased towards the bulls anyway.
Stock Chart Reviews – Below the 50DMA
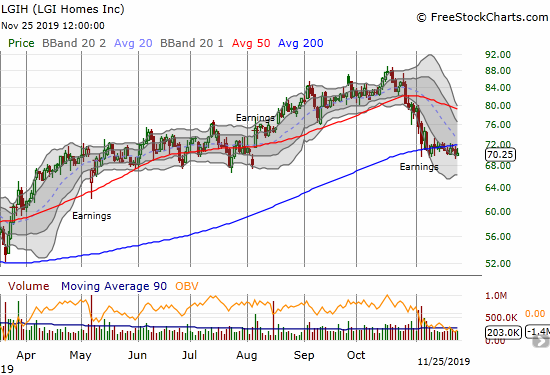
LGI Homes (LGIH)
While many home builders participated in today’s rally, LGI Homes (LGIH) was conspicuous with its lack of participation. LGIH continues to struggle to hold onto its 200DMA even as its 50DMA is in decline. It is a very precarious situation that runs parallel to weakening technicals for other smaller builders.
Stock Chart Reviews – Above the 50DMA
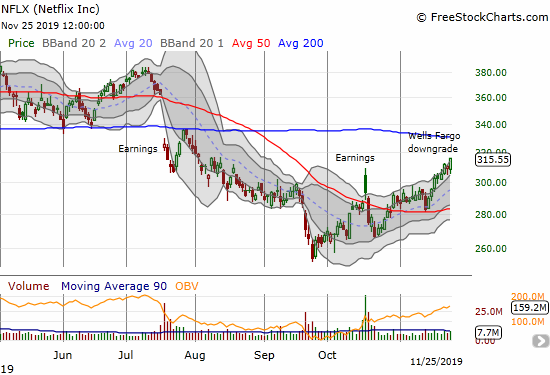
Netflix (NFLX)
Nothing says “buy no matter what” than a quick reversal from a negative analyst call. Wells Fargo downgraded Netflix (NFLX) complaining about hte spending the company needs to suffer to compete. The news is not new and forms the core of many bearish NFLX theses. I have been patiently sitting on a small short position waiting for a challenge of 200DMA resistance to decide on my next move.
— – —
FOLLOW Dr. Duru’s commentary on financial markets via email, StockTwits, Twitter, and even Instagram!
“Above the 40” uses the percentage of stocks trading above their respective 40-day moving averages (DMAs) to assess the technical health of the stock market and to identify extremes in market sentiment that are likely to reverse. Abbreviated as AT40, Above the 40 is an alternative label for “T2108” which was created by Worden. Learn more about T2108 on my T2108 Resource Page. AT200, or T2107, measures the percentage of stocks trading above their respective 200DMAs.
Active AT40 (T2108) periods: Day #219 over 20%, Day #58 over 30%, Day #33 over 40%, Day #30 over 50% (overperiod), Day #6 under 60% (underperiod), Day #46 under 70%
Daily AT40 (T2108)
")
Black line: AT40 (T2108) (% measured on the right)
Red line: Overbought threshold (70%); Blue line: Oversold threshold (20%)
Weekly AT40 (T2108)

*All charts created using FreeStockCharts unless otherwise stated
The T2108 charts above are my LATEST updates independent of the date of this given AT40 post. For my latest AT40 post click here.
Be careful out there!
Full disclosure: long VIXY calls, short NFLX, long IWM calls and calendar call spread
*Charting notes: FreeStockCharts stock prices are not adjusted for dividends. TradingView.com charts for currencies use Tokyo time as the start of the forex trading day. FreeStockCharts currency charts are based on Eastern U.S. time to define the trading day.