
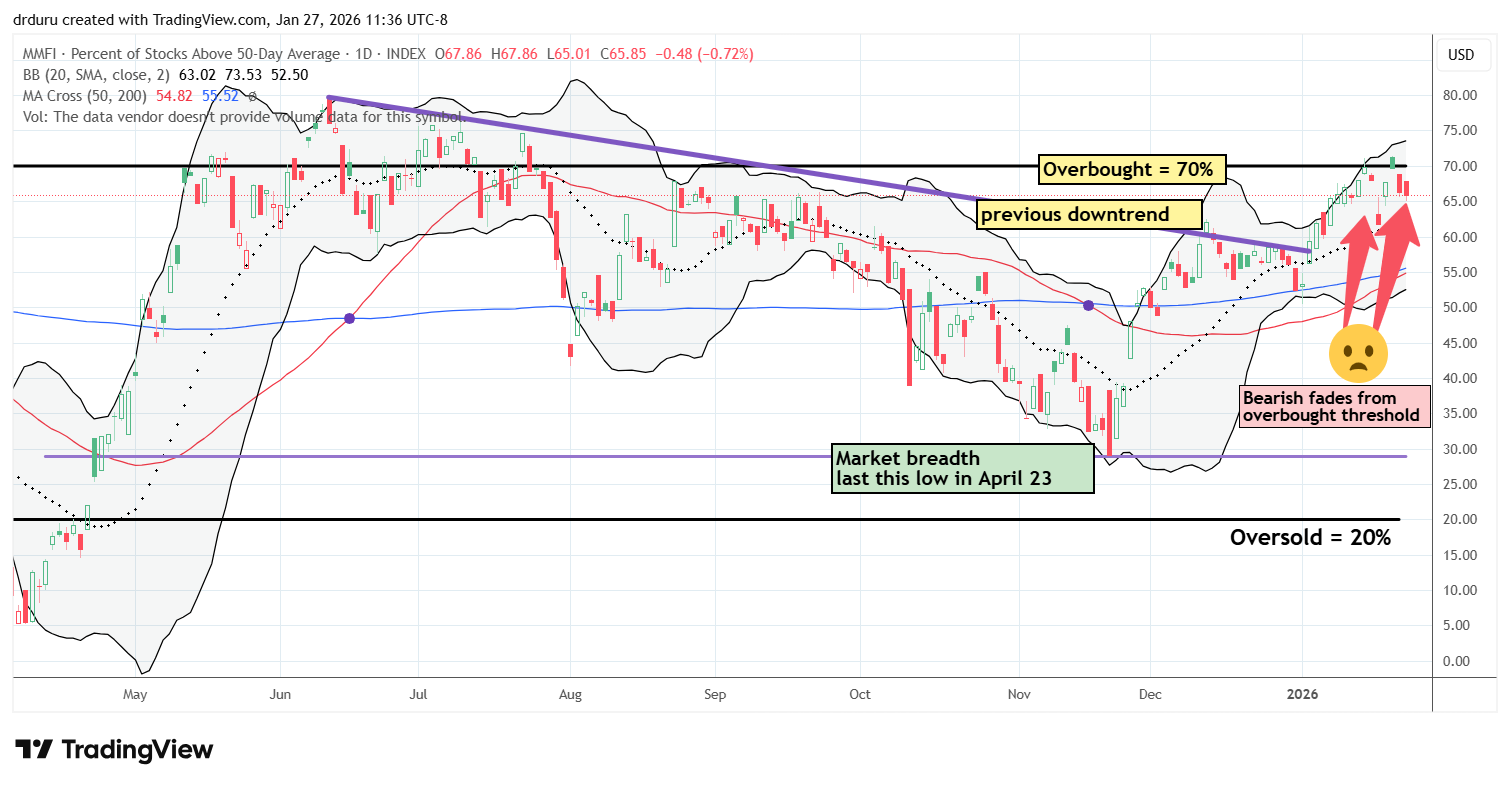
Market breadth is my preferred technical indicator for understanding short-term price action in the stock market. I track breadth using AT50, shorthand for “Above the 50,” which measures the percentage of stocks trading above their 50-day moving averages (DMAs). AT50 becomes most meaningful at its extremes. Readings below 20% define oversold conditions that historically create buying opportunities ahead of market rebounds. Readings above 70% define overbought conditions that signal waning buying pressure and elevated risk of pullbacks or corrections. At these extremes, AT50 has repeatedly constrained the short-term performance of the S&P 500, making it a useful framework for trading market turning points.
Oversold Market Breadth
The Statistics
The stock market experienced 90 oversold periods from September 17, 1986 to April 22, 2025. The table below shows the average and median duration for oversold periods over this time. Segmenting the data from 2010 onward shows that the average oversold duration has remained consistent. However, the increase in the median reveals a tendency for oversold periods to last a little longer in recent years. The most recent example of an extended oversold period occurred during the market turmoil surrounding the 2025 tariff episode.
| 1986 to 2025 | 2010 to 2025 | |
| Average duration | 6.5 | 6.2 |
| Median duration | 3.5 | 5.0 |
| Number of oversold periods | 90 | 37 |
The longest oversold period lasted 42 days in the wake of the 1987 stock market crash. Only three oversold periods have lasted 27 days or more. The majority of oversold periods have lasted 10 days or less.
How to Trade Oversold Conditions
Most importantly, the performance of the S&P 500 (SPY) during the oversold period follows a tradeable pattern. The chart below shows that 69 of 74 (93%) of oversold periods lasting 9 days or less deliver positive gains for the S&P 500. Performance falls rapidly as shown by the purple trendline in the chart. Of the 13 oversold periods lasting between 11 and 20 days, only 2 (15%) delivered a positive performance for the S&P 500. Last year’s oversold period lasted 13 days over which time the S&P 500 lost -2.0%. None of the 3 oversold periods lasting more than 20 days delivered positive gains.
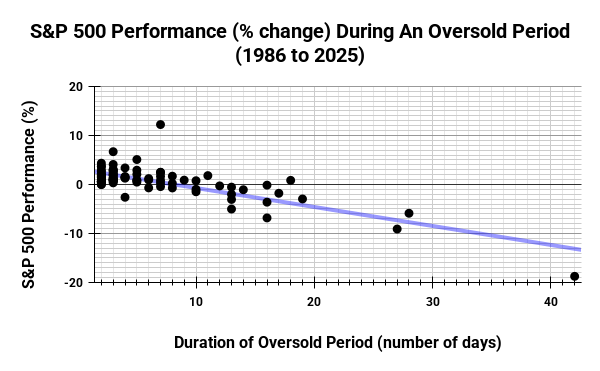
In other words, the odds for profit are highest with the shortest oversold periods. Bounces out of oversold periods can be quite powerful. Because most oversold periods last nine days or less, buying the S&P 500 as soon as oversold trading begins tends to deliver short-term profits; returns increase by accumulating during the oversold period. Short-term traders can consider stopping out after 10 days (depending on the particular price dynamics and market context of the oversold period). Long-term investors can treat oversold periods as uniquely attractive buy-and-hold opportunities.
Overbought Market Breadth
The Statistics
The stock market experienced 237 overbought periods from November 5, 1986 to July 24, 2025. The table below shows the average and median duration for overbought periods over this time. The segmentation starting from 2010 shows strong consistency across both the average and the median. Thus, the performance of overbought periods has been a little more stable than oversold periods.
| 1986 to 2025 | 2010 to 2025 | |
| Average duration | 9.0 | 8.5 |
| Median duration | 4.0 | 4.0 |
| Number of overbought periods | 237 | 88 |
How to Trade Overbought Conditions
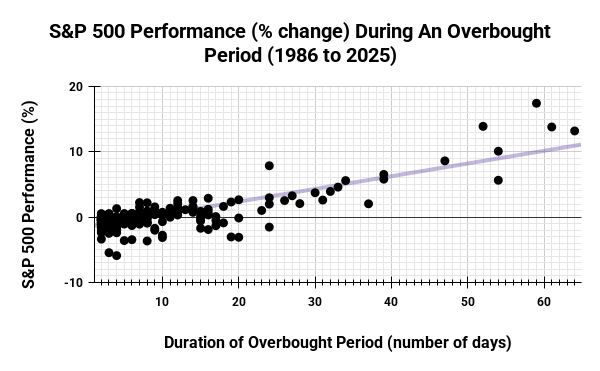
The range of historical performance is much larger for overbought periods than for oversold periods. This price dynamic is a testament to the market’s upward bias over time and the short duration of sell-offs compared to the overall uptrend in the stock market. The table below summarizes the performance of the S&P 500 in different segments of overbought trading scenarios. Similar to the oversold periods, only the first 10 days of an overbought period tend to deliver the expected relationship: in this case, a negative performance for the S&P 500.
| Duration (days) | Total Overbought Periods | Total Negative Overbought Periods | % of Total |
| 10 or less | 178 | 132 | 74% |
| 11 to 20 | 36 | 11 | 31% |
| 21 to 30 | 9 | 1 | 11% |
| 31 to 40 | 7 | 0 | 0% |
| 41 to 50 | 1 | 0 | 0% |
| 51 to 60 | 4 | 0 | 0% |
| Total | 235 | 144 | 61% |
After a 20-day duration for overbought periods, the S&P 500 has only suffered one negative performance. This price dynamic implies that extended overbought periods are structurally more bullish than extended oversold periods are bearish. Thus, if a short-term trader shorts the S&P 500 once overbought trading starts, they should stop out after day 20 (depending on the particular price dynamics and market context of the overbought period). The next bearish opportunity will come after the overbought period ends.
Conclusion: Trading Significance of AT50
As a measure of market breadth, AT50 provides a structured framework for understanding price dynamics during market extremes. The AT50 trading rules I built on this framework are reactive and not predictive. For example, the data and charts above do not provide enough detail to anticipate how long any particular oversold or overbought period may last. Relatedly, there are no predictions for the magnitude of gains or losses during these periods.
The biggest challenge for AT50 trading comes from oversold and overbought periods which last longer than the average or median. At that point, short-term traders have to rely more on additional signals and market context to make trading decisions. For example, I incorporated into the AT50 trading rules a method for using the volatility index (VIX) to gauge timing and risk for the oversold period. I also added a “conservative” (lower risk) approach that triggers buys only after the oversold period ends. The conservative approach for shorting overbought periods is to wait until after they end.
The practical implication of AT50 is that extremes in market behavior are terminal events that inevitably resolve. Those “physics” of market behavior provide profit opportunities when systematically structured as in the AT50 trading rules.
Other related posts on my trading philosophies:
- The Core Logic of Trading in the Zone: A Guide to Consistency for the Analytical Mind
- How to Change from FOMO to No Regrets in the Stock Market
- Individual Stocks Are Rentals, Not Soulmates: Lessons from Morgan Stanley’s Research on Drawdowns
Be careful out there!
Full disclosure: long SPY put options