

Housing Market Intro and Summary
What happened in the housing market in May, 2025? Tariff pressures and economic chaos subsided, yet the stocks of home builders did not benefit as spring failed to deliver sufficient demand to meet soaring inventories. Mortgage rates trended higher again and home prices continued higher. While new home sales reached new recent highs, all but new mortgage applications explain how spring failed to spring.
- The bear market for home builder stocks worsened as their performance diverged sharply from the S&P 500.
- Home builder sentiment resumed its plunge and augurs poorly for future housing activity.
- Single-family housing starts dropped again while building permits plunged to a 2-year low.
- Sales of new single-family homes increased to a 3-year high. Downward revisions look likely given other housing data.
- Existing home sales slid further into spring buying season disappointment as spring failed to match demand with surging inventory.
- California’s existing home market experienced historic levels of active listings.
- Mortgage rates trended higher most of May while a large jump in new mortgage applications provided some support for stronger new home sales.
Housing Stocks
The iShares US Home Construction ETF (ITB) extended its bear market for another month. The ETF of housing related stocks even underperformed the S&P 500 (SPY) in May. ITB drifted downward into a 2.8% decline while the S&P 500 soared 6.2%. The S&P 500 continues to enjoy the tailwinds of a rebound from the tariff drama of March and April, while housing stocks suffer from the burdens of high mortgage rates and poor housing affordability. The tariff drama continues for home builders who are facing higher prices and lower margins.
May’s divergent performance put an exclamation point on the end of a seasonal trade for home builders that suffered from historically bad performance. ITB is down 13.5% year-to-date while the S&P 500 (SPY) is actually up 0.5% and close to its all-time high. I remain wary about the downstream implications of on-going weakness for housing. The wide performance divergence seems set to resolve with the S&P 500 coming back down if the various pauses on tariff drama get extended or, worse, lead to fresh acrimony (for now the index is well-supported).
")
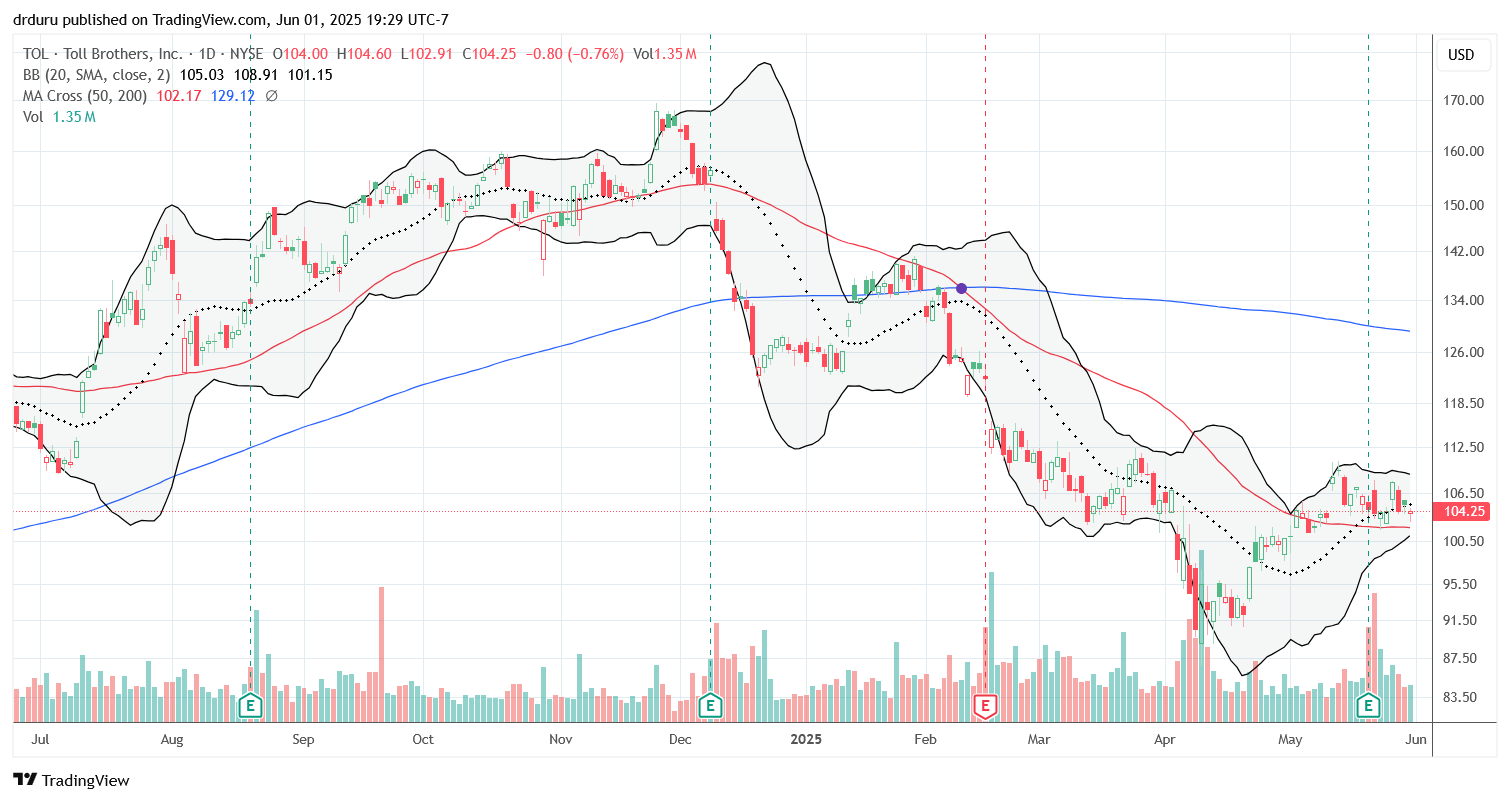
There are only two home builder stocks in my universe that have avoided trading lower since reporting their last earnings. I covered Pulte Home (PHM) in my last Housing Market Review after it enjoyed a now rare post-earnings surge higher. Toll Brothers (TOL) is clinging to an overall flat performance after initially jumping over 5% in the after-hours following its earnings report. Helping TOL’s cause is (surprisingly) unchanged earnings guidance and a confidence-boosting expansion of its share repurchase authorization to $600M. As a builder of luxury homes, TOL should hold up better than most builders.
TOL gained 3.4% for May and currently trades above important 50DMA support (the red line below). I continue to hold shares in TOL as a part of the busted seasonal trade on home builders.
Housing Data
Home Builder Confidence: The Housing Market Index – May, 2025
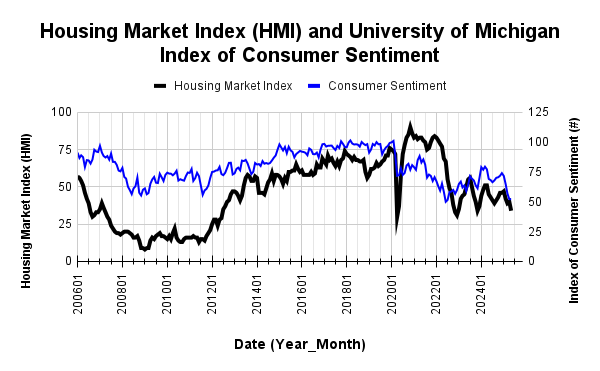
The National Association of Home Builders (NAHB)/Wells Fargo Housing Market Index (HMI) resumed its plunge. In April, the HMI gained one point after two months of plunges. In May, the HMI plunged another 6 points to a level last seen in November, 2023. The NAHB blamed the familiar cocktail of calamities: “uncertainties stemming from elevated interest rates, tariff concerns, building material cost uncertainty and the cloudy economic outlook.” Yet, the organization also pointed out that 90% of the responses came before the U.S. and China announced a kind of ceasefire in its trade war. Even so, the NAHB noted that “78% [of builders] reported difficulties pricing their homes recently due to uncertainty around material prices.” This sinking sentiment puts into context the on-going poor performance of home builder stocks.
The HMI components fell in unison. Given the pressing nature of the trade hostilities, I am not surprised that the “Single Family: Present” component fell the most. At 37, this component fell all the way to levels last seen at the trough of the last bear market in 2022. At 36, that level in turn matched the pandemic lows. Thus, sentiment is about as low as it can be in the present. The other two components fell to levels last seen at the end of 2023.
/Wells Fargo Housing Market Index (HMI) and the University of Michigan Index of Consumer Sentiment")
Source for data: NAHB and the University of Michigan
Consumer sentiment stayed flat from April to May. Consumer sentiment was last this low back in 2022 and thus matches and reinforces the on-going pessimism among home builders.
Pricing power declined for builders. The 34% share of builders cutting prices is the highest level since December, 2023. The share of builders providing incentives stayed flat with April at 61% while the average price discount was also flat at 5%.
Each region experienced a sequential drop in its HMI. The South extended its losing streak to 5 straight months and dropped to a level last seen in November, 2022. The West fared similarly poorly. The Northeast dropped just 1 point. The Midwest declined three points. The South shed 5 points and the West lost a whopping 8 points. Given the wide disparity in losses, I think the aggregate HMI could fall again in June even with the tariff relief now in place. The South and West seem to have region-specific issues brewing.
New Residential Construction (Single-Family Housing Starts) – April, 2025
Single-family housing starts slipped further in April as sagging builder sentiment continued its drag on start activity. After plunging 13.8% from February to March, starts fell another 2.1% sequentially and 12.0% year-over-year. The 12-month high in February is now a distant memory. Starts may even stay below the one million mark longer than I would have expected just a few months ago.
![US. Bureau of the Census, Privately Owned Housing Starts: 1-Unit Structures [HOUST1F], first retrieved from FRED, Federal Reserve Bank of St. Louis, June 1, 2025](https://drduru.com/onetwentytwo/wp-content/uploads/2025/06/20250601_Housing-starts-April-2025.png "Housing starts")
Building permits are now trending downward. March delivered the first significant decline since the trough last June. Permits plunged 5.0% from March to April and hit a 2-year low. The 6.1% year-over-year decline aligns with the on-going decline in sentiment and now augurs more poorly than ever for future housing starts. Accordingly, I expect the next round of earnings reports from builders to further disappoint the market.
While starts declined significantly in April, the Northeast managed to surge year-over-year (the West was the regional exception in March). The Northeast, Midwest, South, and West each changed +17.5%, -7.7%, -14.8%, -14.9% respectively year-over-year.
New Residential Sales (Single-Family) – April, 2025
New home sales stick out as an anomaly amid all the dour news of the spring buying season. Like me, the NAHB expects downward revisions to come: “The April new home sales figure may be revised as it runs counter to market commentary and the fact that builder sentiment moved markedly lower in May.”
Since November 2022, new home sales have bounced between 595K and 741K. April sales actually pierced the top of the range to 743K new single-family homes. This level marked a 10.9% surge in sales from March and a 3.3% year-over-year jump. The large sequential jump is exaggerated by a substantial downward revision in March sales from 724K to 670K. Thus, my musings from the last Housing Market Review apply to April and not March: I am wondering whether builders pivoted to drawing down on inventory (since housing starts are on the decline). This large downward revision also supports expectations for another downward revision for April sales given the overall poor spring buying season.
![US. Bureau of the Census, New One Family Houses Sold: United States [HSN1F], first retrieved from FRED, Federal Reserve Bank of St. Louis, June 1, 2025](https://drduru.com/onetwentytwo/wp-content/uploads/2025/06/20250601_New-home-sales-April-2025.png "new home sales")
For April, the median price for new homes increased ever so slightly by 0.9% sequentially and declined 2.0% year-over-year to $407,200, still the third lowest price in three years. A very slow and choppy downtrend continues to unfold from the all-time high in October, 2022. As with many of the prior swings, April’s price swung with notable changes in sales mix.
In January, there was a sharp shift in price to the middle of the price distribution with the $400,00 to $599,999 range collectively gaining 7 percentage points. For February, the $300,000 to $399,999 range was the only tier to gain share (from 27% to 34%). In March, the distribution completely swung to homes priced under $500,000 both sequentially and year-over-year. Like February, the $300,000 to $399,999 range was the only tier to gain share from March.
April’s inventory decreased from March’s 9.1 (revised significantly upward from 8.3 given the sales revision) to 8.1 months of sales. For comparison, a year ago inventory sat at 7.7 months of sales. Absolute inventory declined sequentially for the first time in almost a year. Still, inventory around these levels was last this high 17 1/2 years ago. The NAHB is finally more wary about total inventory levels. From its report on new home sales:
“…when accounting for existing, single-family home sales (a market which is showing rising inventory levels), total home inventory (new plus existing homes) is at a 4.8 months’ supply as of April. This is up from 4.6 from March and up from 4.1 from a year ago. The current reading is the highest since late 2015. Prior analysis indicates that the market will face notable inventory impacts on production as this measure approaches 5.5.”
The Northeast was the only region to lose sales year-over-year. For the second month in a row, the region suffered a substantial loss. Northeast sales are also approaching bottom of a range in place since 2016. The Northeast, Midwest, South, and the West changed -25.8%, +1.2%, +6.5%, and +1.3% respectively year-over-year.
Existing Home Sales – April, 2025
February existing home sales surged to recent highs and gave fresh hope for the spring buying season. March sales brought the picture right back down to reality with a 5.9% drop to levels last seen in October, 2024. April existing home sales slid further into spring buying season disappointment. Sales declined 0.5% from March and 2.0% year-over-year. Pending home sales rebounded sharply from lows last seen in the trough of the pandemic, but it is too early to tell whether this could result in a robust end to a disappointing spring buying season.

(For historical data from 1999 to 2014, click here. For historical data from 2014 to 2018, click here) Source for chart: National Association of Realtors, Existing Home Sales© [EXHOSLUSM495S], retrieved from FRED, Federal Reserve Bank of St. Louis, June 1, 2025

The desired correlation between inventory and sales failed yet again to materialize. Sellers responded to the spring buying season by sending inventory surging 9.0% over March’s levels only to find lukewarm buyers. As a reminder, in the report on February sales, the NAR celebrated February’s increase in sales and inventory by stating “…more inventory and choices are releasing pent-up housing demand.” The NAR did not explain why this pent-up demand failed to show up in March, but blamed high mortgage rates for the lack of a demand response in April: “Pent-up housing demand continues to grow, though not realized. Any meaningful decline in mortgage rates will help release this demand.”
April inventory hit 1.45M, not only a 9.0% increase month-over-month but also a 20.8% year-over-year surge, a second straight month of such a surge. According to the NAR, “Unsold inventory sits at a 4.4-month supply at the current sales pace, up from 4.0 months in March and 3.5 months in April 2024.” The months of supply and absolute inventory have now increased for four consecutive months.
The surge in inventories did not cool off pricing pressures, an on-gong pattern. Year-over-year pricing jumped again despite the surge in year-over-year inventories. The median sales price of an existing home increased 2.7% from March to $414,000 and increased 1.8% year-over-year. This 22nd straight year-over-year increase and highest ever April median price represents the relentless march that soon will take the median price above last June’s record high of $426,900.
After several times taking the side of existing home owners when describing upward price pressures, the NAR finally gave some hope to buyers struggling with affordability:
“At the macro level, we are still in a mild seller’s market…But with the highest inventory levels in nearly five years, consumers are in a better situation to negotiate for better deals.”
The average time on the market for an existing home decreased from 36 days in March to 29 days in April. While the spring buying season featured a sequential decline in time on the market, the year-over-year increase from 26 days characterizes the sluggish seasonal market.
The share of sales going to first-time home buyers continued its spring season upward momentum. These sales increased from a 28% share in January to 31% in February to 32% in March and now 34% in April, up from 33% a year ago. The NAR’s 2017 Profile of Home Buyers and Sellers reported an average of 34% for 2017, 33% for 2018, 33% for 2019, 31% for 2020, 34% for 2021, 26% for 2022, 32% for 2023, and a plunge to an all-time low of 24% in 2024.
In March, the West flipped from being a large contributor to sequential sales gains in February to the largest contributor to the sequential sales decline. For April, the Northeast was the only region not to decline in sales year-over-year. It was flat for the second month in a row (a mild contrast to the decline in new home sales!). The regional year-over-year changes were: Northeast 0%, Midwest -1.0%, South -3.2%, West -1.3%.
Single-family existing home sales decreased 0.3% from March to 3.63M in April and decreased by 1.4% year-over-year. The median price of a single-family home was $418,000, up 1.7% year-over-year and up 2.6% month-over-month.
California Existing Home Sales – April, 2025
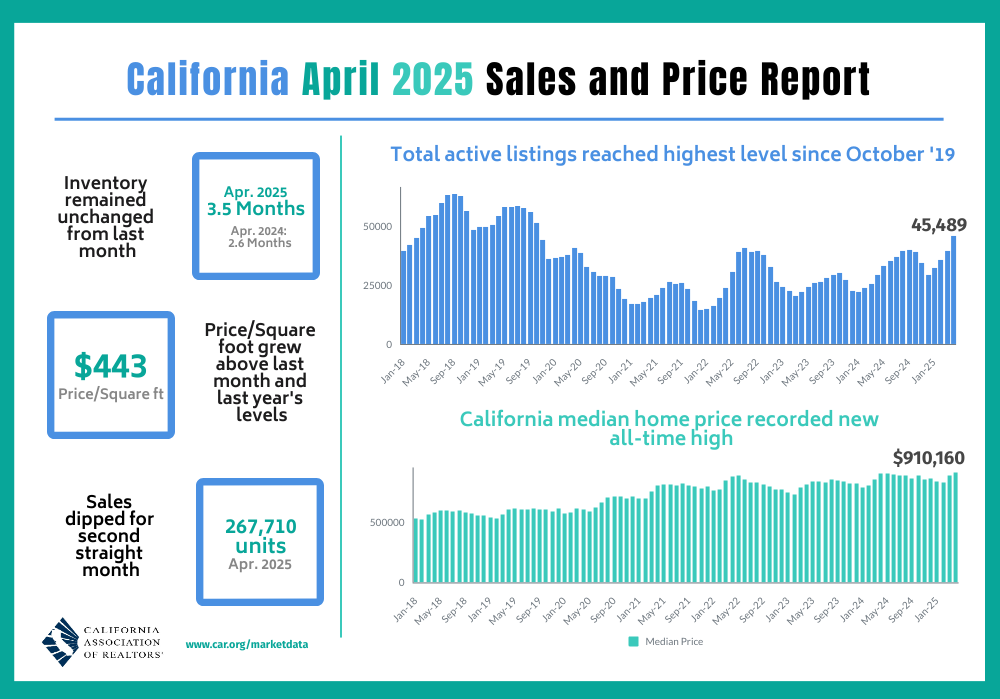
The decline in sales volatility held for California’s market for existing homes. Sales plunged 10.0% from December to January, surged 11.6% from January to February, declined 2.3% from February to March, and declined 3.4% from March to April. The two straight months of declines underline a soft spring buying season. The 267,710 in sales is down 0.2% year-over-year. California underperformed the West region as a whole.
The California Association of Realtors (C.A.R.) listed a familiar set of factors dampening demand. The organization also expects the soft market to continue until the U.S.’s trade war with the world comes to an end (I do not expect “trade negotiations” to end anytime soon – they will likely be a salient and on-going feature of the U.S. and global economy in coming years). The C.A.R. again pointed to volatility in mortgage rates as a factor wearing on housing demand.
Despite soaring inventories, the median price reached a new record with a 2.9% month-over-month gain and 0.2% year-over-year increase to $910,160. The median price has increased year-over-year for 22 months in a row. The median price per square foot was essentially flat year-over-year. The C.A.R. yet again took some solace in the slower pace of price gains: “April’s slower price growth may signal that price moderation could persist as market uncertainties and economic concerns remain. Despite reaching a new record, prices are moderating as the latest yearly growth pace slowed to its lowest since mid-2023…a steady increase in inventory has contributed to more moderate price growth this year.”
California’s housing supply expanded at a rapid clip in April in terms of active listings even as the unsold inventory index (UII) remained flat with March’s 3.5. March’s total active listings rose at the fastest pace since January 2023 on a year-over-year basis, and April’s total active listings did the same. Moreover, total active listings hit a 5 1/2 year high, a 15th straight month of a year-over-year gain. New active listings reveal the underlying surge in California’s inventory. According to the C.A.R.:
“New active listings at the state level rose year-over-year by double-digits for the fourth consecutive month…Newly added units [grew] 10.8 percent month-over-month in April. While it was a smaller clip than the growth pace registered in March, the monthly increase was the strongest March-to-April growth recorded since 2019.”
The median time on market increased year-over-year from 16 to 21. The C.A.R.’s statewide sales-price-to-list-price ratio remained flat year-over-year at 100.0%.
Home closing thoughts
Tulsa Attracts Remote Workers
Tulsa Remote is an initiative designed to attract remote workers to Tulsa, Oklahoma, by offering a $10,000 grant and a supportive community to help newcomers thrive. Eligible applicants must be at least 18 years old, authorized to work in the U.S., employed full-time in a remote position outside Oklahoma, have lived outside the state for at least a year, and be willing to relocate to Tulsa within 12 months of acceptance. The application process includes an online submission, a virtual interview, and, if selected, a background check and income verification. Once relocated and settled—either by renting or purchasing a home—participants can receive the grant in monthly installments or as a lump sum through the Homeownership Initiative. Beyond financial incentives, Tulsa Remote offers members access to coworking spaces, wellness resources, and a calendar of social and professional events, fostering a vibrant community of remote professionals in the city.
Separately, I read that this program is providing a boost to the Tulsa economy. Thus, copycats should emerge in the near future.
Spotlight on Mortgage Rates
The Mortgage Bankers Association (MBA) reported weekly decreases in mortgage applications for three of four weeks. The 23-month streak of strong year-over-year performances in new home mortgage purchase applications came to an end in January with a 6% decrease, and continued their decline with another 6.9% decline in February. March delivered a fresh rebound with a 5.5% year-over-year increase in mortgage applications. April continued the fresh momentum with a 5.3% year-over-year increase in mortgage applications.
If not for the surrounding poor data, I would dare to anticipate a late pick-up in the spring buying season. The MBA noted that “the applications index reached its highest level in the survey’s history dating back to 2012.” This impressive milestone supports the sudden breakout in new home sales for April (and thus leans against a significant downward revision). The MBA’s mortgage data drove a forecast of 718,000 new single-family homes for April, just below the 743,000 in the Census Bureau’s later estimate. Perhaps a coming downward revision will be relatively mild. The MBA further observed that “as the unsold inventory of new homes continues to grow in many parts of the country, reduced buyer competition and pricing pressures supported more buying activity over the month.”
This promising application activity may be driven by a rush to get ahead of rates topping 7% again. Mortgage rates trended higher almost all of May and look set to hit 7% again, a level I still assume will hold as a top. However, on-going economic uncertainties, particularly from the U.S.’s trade war, and a ballooning U.S. budget deficit are putting upward pressure on long-term Treasury yields and in turn nudging mortgage rates higher. Stubbornly high mortgage rates have contributed to the poor performance of the spring buying season. Clashing with hopes that the Federal Reserve will cut rates later this year are the on-going inflationary threats from tariff policies. Once some component of these headwinds die down, the stocks of home builders could become one of the better bets in the stock market.
![Freddie Mac, 30-Year Fixed Rate Mortgage Average in the United States [MORTGAGE30US], retrieved from FRED, Federal Reserve Bank of St. Louis; June 1, 2025](https://drduru.com/onetwentytwo/wp-content/uploads/2025/06/20250601_30-Year-Fixed-Rate-Mortgage-Average-in-the-United-States.png)
Be careful out there!
Full disclosure: long ITB, long TOL