

Stock Market Commentary
The stock market is right back to levels seen right before the entire tariff trauma and drama unfolded, but does this reversal mean all is well? Confirmation awaits the next breakouts.
The April jobs report appeared to provide additional relief to the stock market. The U.S. economy added 177,000 jobs and the unemployment rate remained at 4.2%. Importantly, this jobs report is the first to show a full month’s impact of the slashing of government jobs. Per the report, “federal government employment declined by 9,000 in April and is down by 26,000 since January. (Employees on paid leave or receiving ongoing severance pay are counted as employed in the establishment survey.)”
Two sectors more than made up for these losses. Health care added 51,000 jobs in April. Transportation and warehousing increased by 29,000, a big surprise given how tariffs have started to slow global trade. For example, Marketplace reported that “forty-five percent of ships originally bound from China to the West Coast are now just idling mostly outside China, according to Project44, a company that monitors global shipping trends.” Something tells me growth in transportation and warehousing will grind much lower in May onward.
Regardless, on balance, the jobs report provided a convenient bridge in market sentiment after a negative GDP print created a hiccup in the oversold bounce. The bounce remains as strong as ever, nine days straight and running.
The Stock Market Indices
S&P 500 (SPY)
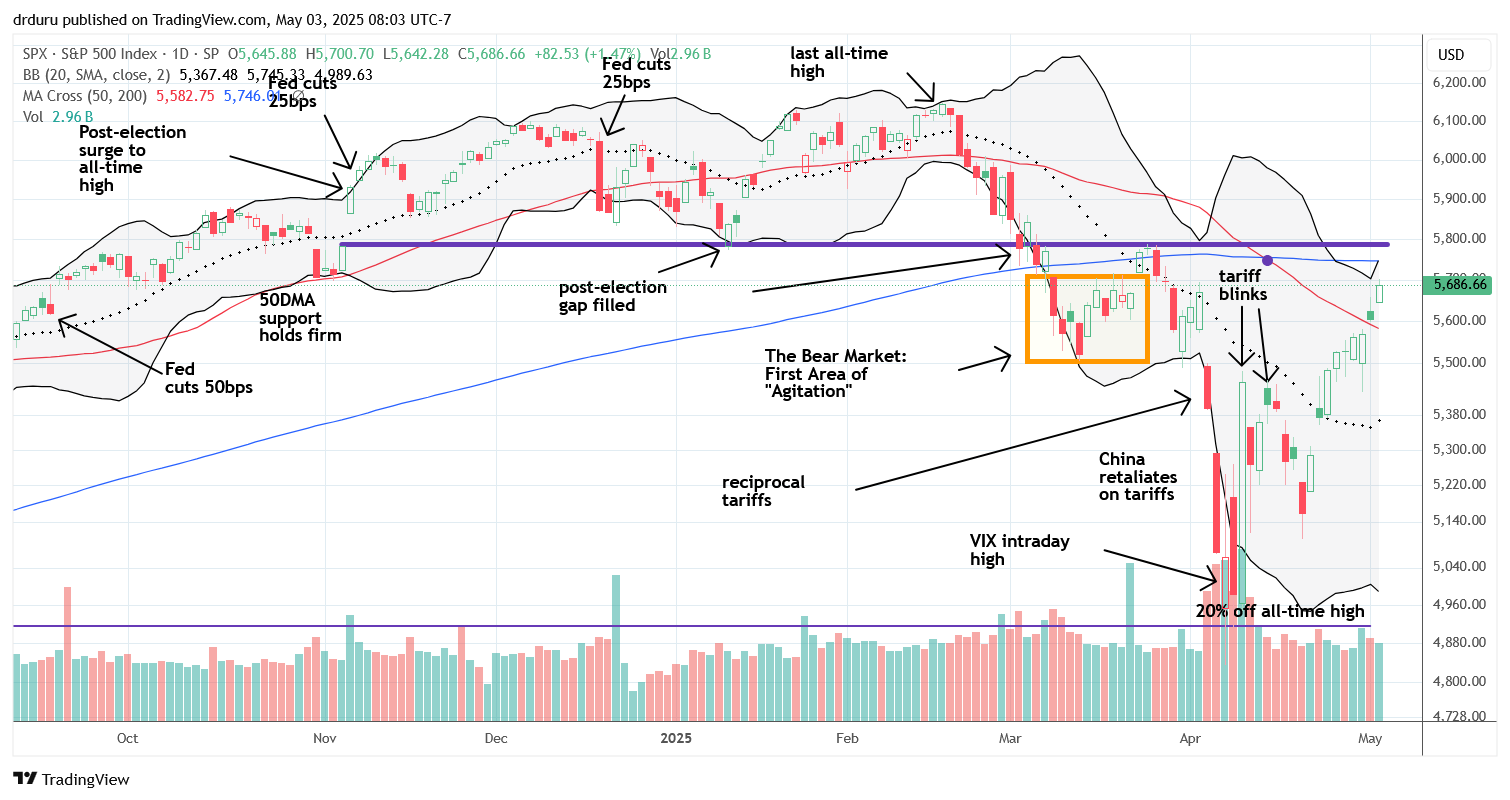
The S&P 500 broke out above its 50-day moving average (DMA) (red line) and confirmed the breakout with a second close higher. The index is now closing in on a challenge of its 200DMA (blue line). For me, the S&P 500 remains in a bear market because it trades below its 200DMA. This upcoming challenge is critically important. Just above the 200DMA lies resistance at the election day close, a level that acted as support in January before giving way in early March, marking the start of the broader bear market. I expect the 200DMA and election day close to give tough fights as resistance.
The S&P 500 not traded right back to pre-tariff levels, but also the index is on a 9-day winning streak. The last such streak occurred 20 years ago. So I fully the expect to “tire” as it runs into overhead resistance.
NASDAQ (COMPQ)
The NASDAQ has a similar story. The tech laden index confirmed a 50DMA breakout and is nearing a test of its 200DMA. This resistance level converges with the last peak before the tariff drama began.
")
iShares Russell 2000 ETF (IWM)
The iShares Russell 2000 ETF (IWM) broke out above its 50DMA and needs a higher close to confirm the breakout. I took profits on an IWM May call spread, making me REALLY wish I had doubled down on Wednesday’s hiccup as intended. Now that IWM looks more constructive, I will return to frequent call buying on IWM. While the general stock market remains positive, I expect IWM to eventually test 200DMA resistance.
")
The Short-Term Trading Call Right Back
- AT50 (MMFI) = 51.1% of stocks are trading above their respective 50-day moving averages
- AT200 (MMTH) = 34.6% of stocks are trading above their respective 200-day moving averages
- Short-term Trading Call: cautiously bullish
AT50 (MMFI), the percentage of stocks trading above their 50DMAs, closed at 51.1%. My favorite technical indicator is supporting the bullish oversold bounce with its own 9-day winning streak. In fact, since its bottom on April 8th, AT50 has only been down three days. The strength of this run suggests AT50 could actually test the overbought threshold as soon as this week if not next week. If so, this test would likely coincide with critical tests of 200DMA resistance by the S&P 500 and/or the NASDAQ, maybe even IWM.
This near synchronous 50DMA breakout across the major indices is very bullish, but I am keeping the short-term trading call at cautiously bullish given the imminent 200DMA tests and the lingering potential for policymakers to say and do things that throw the stock market for a loop. I for one am still waiting on some deals to get finalized to avoid triggering a return of reciprocal tariffs in July…
The Volatility Index (VIX)
The volatility index (VIX) continued its steady downtrend, closing at 22.7 for the week, nearly right back to pre-tariff drama levels. Like AT50’s ascension, the VIX’s downtrend continues to support the bullish underpinnings of the oversold bounce. Given the current momentum, the VIX could return to its 12 to 15 lows in short order.
")
The Equities: Right Back
iShares Expanded Tech Software Sector ETF (IGV)
IGV is even more bullish than the major indices. This ETF of cloud software companies confirmed a 50DMA and 200DMA breakout at the same time. IGV is now on track to test its double top from February and last December. I missed buying the breakout, but I am still a buyer at current levels.
")
Shake Shack (SHAK)
Shake Shack (SHAK) had a solid earnings day, gaining 6.4% and moving above its 50DMA. SHAK is a buy here for me with a stop loss below $88.50. I of course prefer to to buy on a pullback closer to 50DMA support around $92.
")
NVIDIA Corporation (NVDA)
NVDA gained 2.6% and broke out above its 50DMA, joining the growing number of bullishly positioned stocks. I took profits on a calendar call spread at the $115 strike as I was afraid NVDA might close the day above $115. I plan to jump right back in next week unless the stock gaps significantly higher on Monday. NVDA survived negative news on competition from Huawei in China.
")
Fair Isaac Corporation (FICO)
Credit rating company Fair Isaac Corporation (FICO) continues to impress. The stock survived earnings and completed a successful test of 200DMA support. I bought FICO shortly after I pointed out a bullish setup in mid-March. I am glad I hung on for dear life; tariffs should have zero direct impact on FICO.
")
Microsoft (MSFT)
Microsoft (MSFT) posted fantastic earnings, initially gaining up to 9-10% after hours and ending the post-earnings day 7.6% higher. Buyers pushed MSFT up an additional 2.3% on Friday for a confirmation of the 200DMA breakout. I am a buyer on dips from here.
")
Intuitive Surgical (ISRG)
ISRG held above its 200DMA ahead of the tariff drama and confirmed a breakout above converged resistance at its 50DMA and 200DMA. With the stock also clearing the close on the day of the tariff pause, ISRG looks clear to test all-time highs in coming weeks or months.
")
Avis Budget Group, Inc (CAR)
Avis Budget Group (CAR) proved me wrong. Despite my doubts during the tariff drama, CAR soared 16.4% on April 17th on a 50DMA breakout and soon after confirmed a breakout above its 200DMA. I will closely watch earnings next week…with no intention to buy. I remain skeptical.
")
")
")
Be careful out there!
Footnotes
Subscribe for free to get email notifications of future posts!
“Above the 50” (AT50) uses the percentage of stocks trading above their respective 50-day moving averages (DMAs) to measure breadth in the stock market. Breadth defines the distribution of participation in a rally or sell-off. As a result, AT50 identifies extremes in market sentiment that are likely to reverse. Above the 50 is my alternative name for “MMFI” which is a symbol TradingView.com and other chart vendors use for this breadth indicator. Learn more about AT50 on my Market Breadth Resource Page. AT200, or MMTH, measures the percentage of stocks trading above their respective 200DMAs.
Active AT50 (MMFI) periods: Day #6 over 20%, Day #4 over 30%, Day #2 under 40%, Day #1 over 50% (overperiod ending 54 days under 50%), Day #80 under 60% (underperiod), Day #181 under 70%
Source for charts unless otherwise noted: TradingView.com
Full disclosure: long IWM shares, long FICO, long ISRG, long SPY shares and put spread
FOLLOW Dr. Duru’s commentary on financial markets via StockTwits, BlueSky, and even Instagram!
*Charting notes: Stock prices are not adjusted for dividends. Candlestick charts use hollow bodies: open candles indicate a close higher than the open, filled candles indicate an open higher than the close.
* Blog notes: this blog was written based on the heavily edited transcript of the following video that includes a live review of the stock charts featured in this post. I used ChatGPT to process the transcript.
Is FICO a buy here at 2000?
Sorry for the late reply. I am long and staying long, so technically that means I would buy it here (currently $2075). Just be prepared for a pullback to support around $1930.