Stock Market Commentary
Inflation was the big story last week. I covered the details in “Bonds Try to Weigh on A Market Trying Harder to Look Past Stabilizing Inflation“. The stock market had a curiously mixed reaction that highlighted an on-going bearish divergence for the month of December. A market breadth breakdown contradicted impressive strength in tech stocks. Moreover, small cap stocks have declined all month while the S&P 500 stayed mainly flat for the week. A freshly interesting twist comes in the form of the equal weighted S&P 500: this index has mirrored small caps all month and further emphasizes this month’s market breadth breakdown. The upcoming decision on monetary policy from the Federal Reserve could provide a deciding pivot for this bearish divergence.
The Stock Market Indices
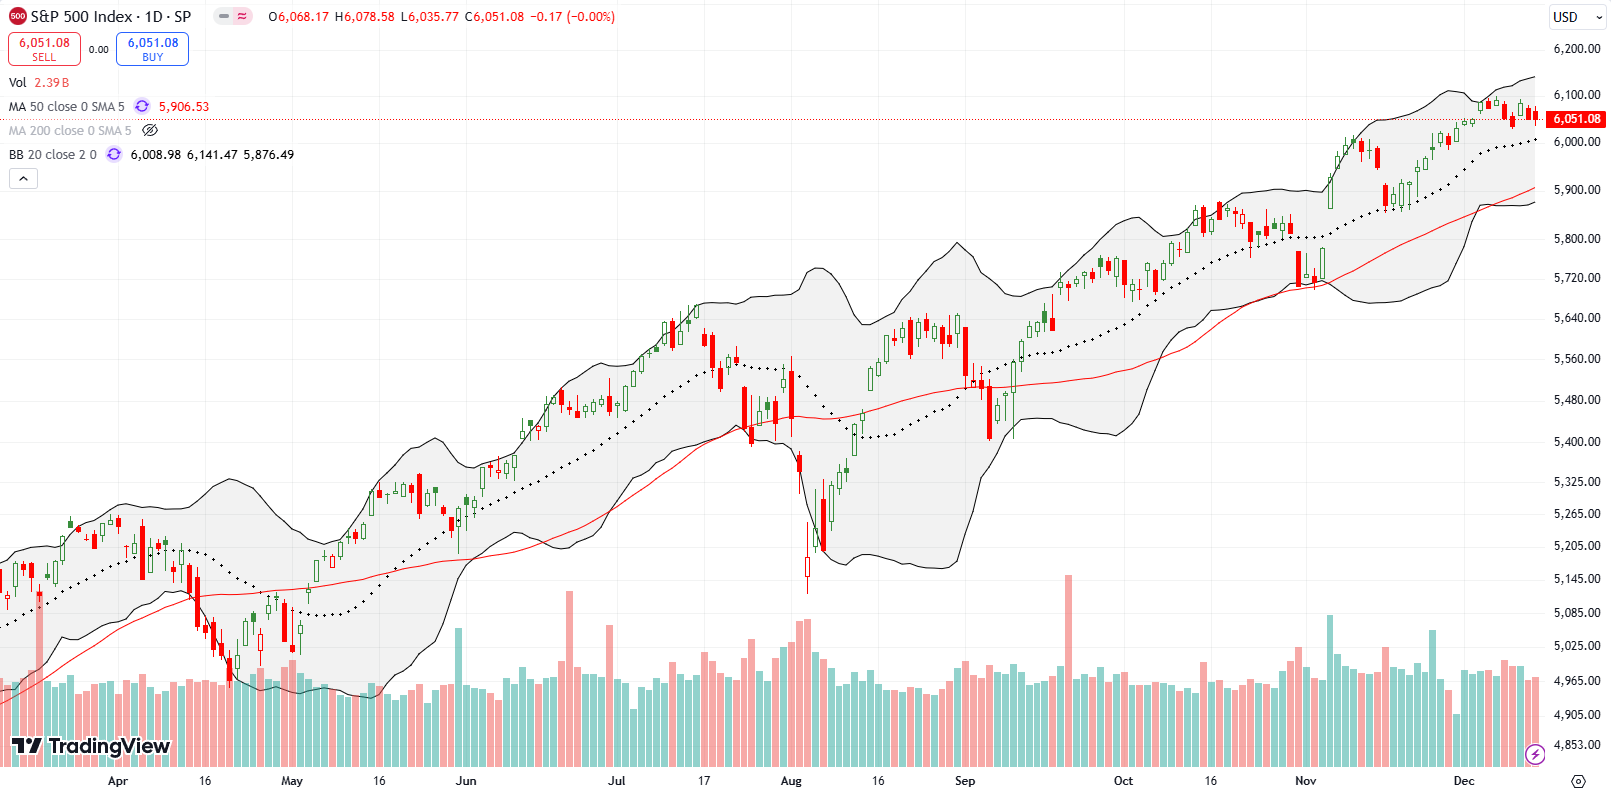
The S&P 500 (SPY) lost 0.6% for the week but essentially churned up and down in a tight range. Support at the 20-day moving average (DMA) (the dashed line below) beckons for a fresh test.
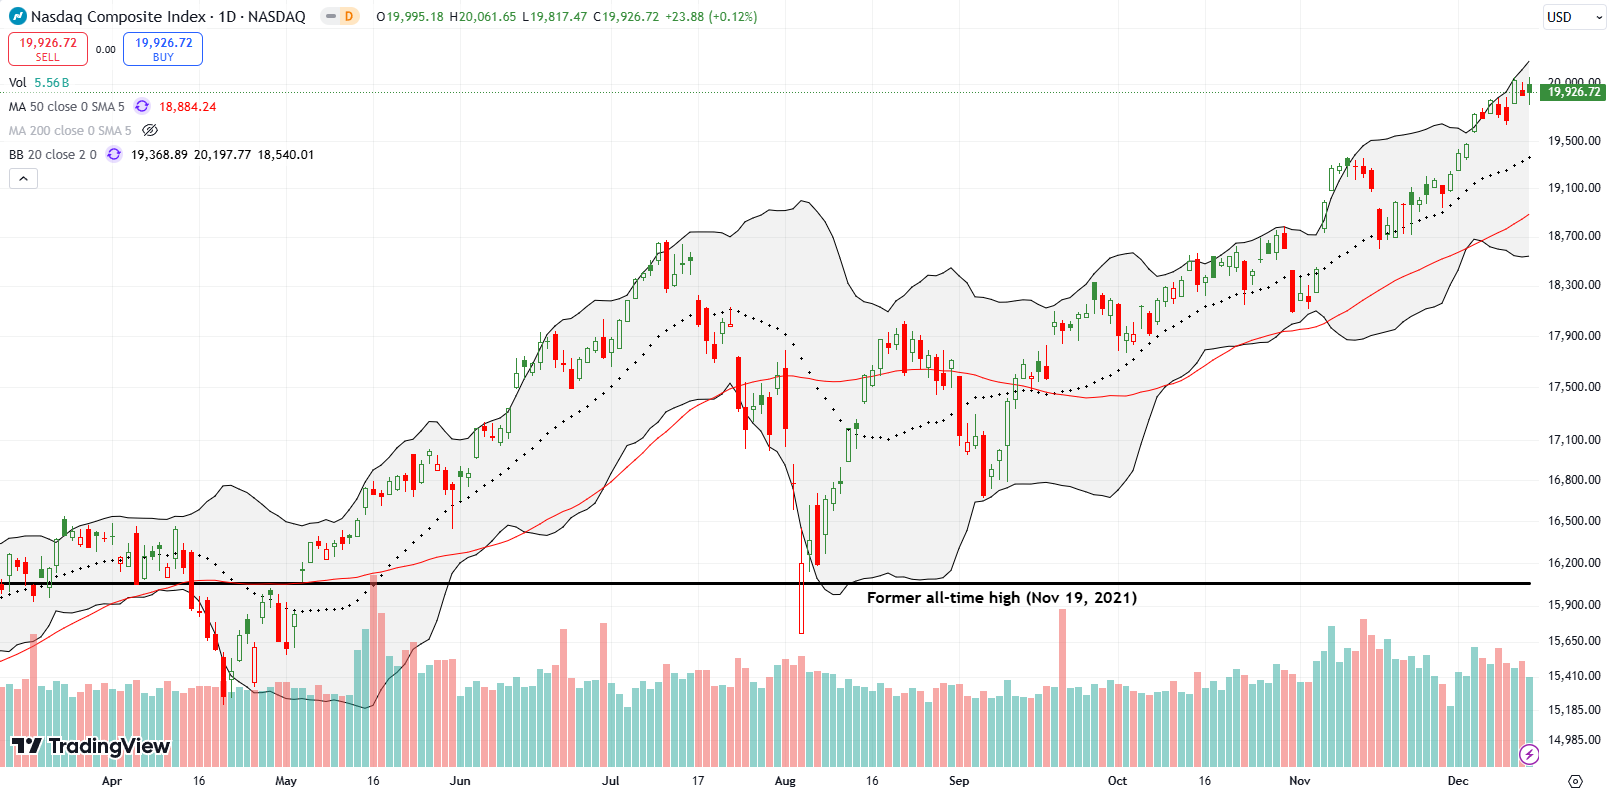
The NASDAQ (COMPQX) only gained 0.3% for the week, but the price action looked very positive relative to the other major indices. On Wednesday, the tech laden index hit an all-time high partially thanks to a follow-through surge by Alphabet Inc (GOOG). The NASDAQ looks poised for higher prices next week if the Federal Reserve cooperates.
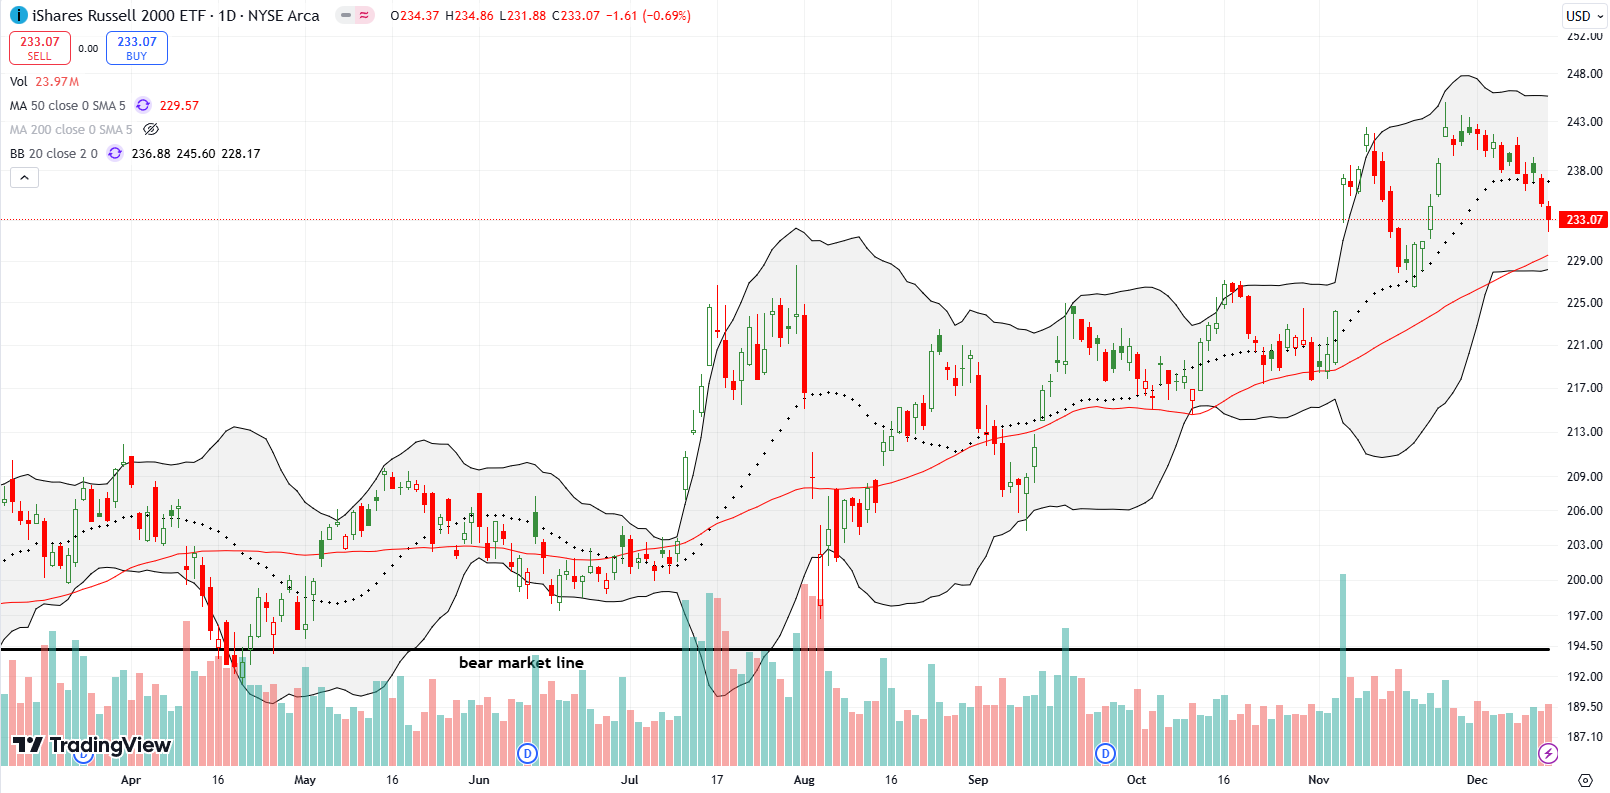
The iShares Russell 2000 ETF (IWM) simply refuses to sustain momentum with chunks of bursts higher followed by deep pullbacks. The blow-off top that I feared for the index of small caps played out in slow but steady form. IWM has dribbled lower all month in a notable bout of under-performance. Last week’s 20DMA breakdown opened the door to an imminent test of 50DMA support (the red line) after a 2.5% loss for the week. My latest round of call options will likely fail.
The Short-Term Trading Call With A Market Breadth Breakdown
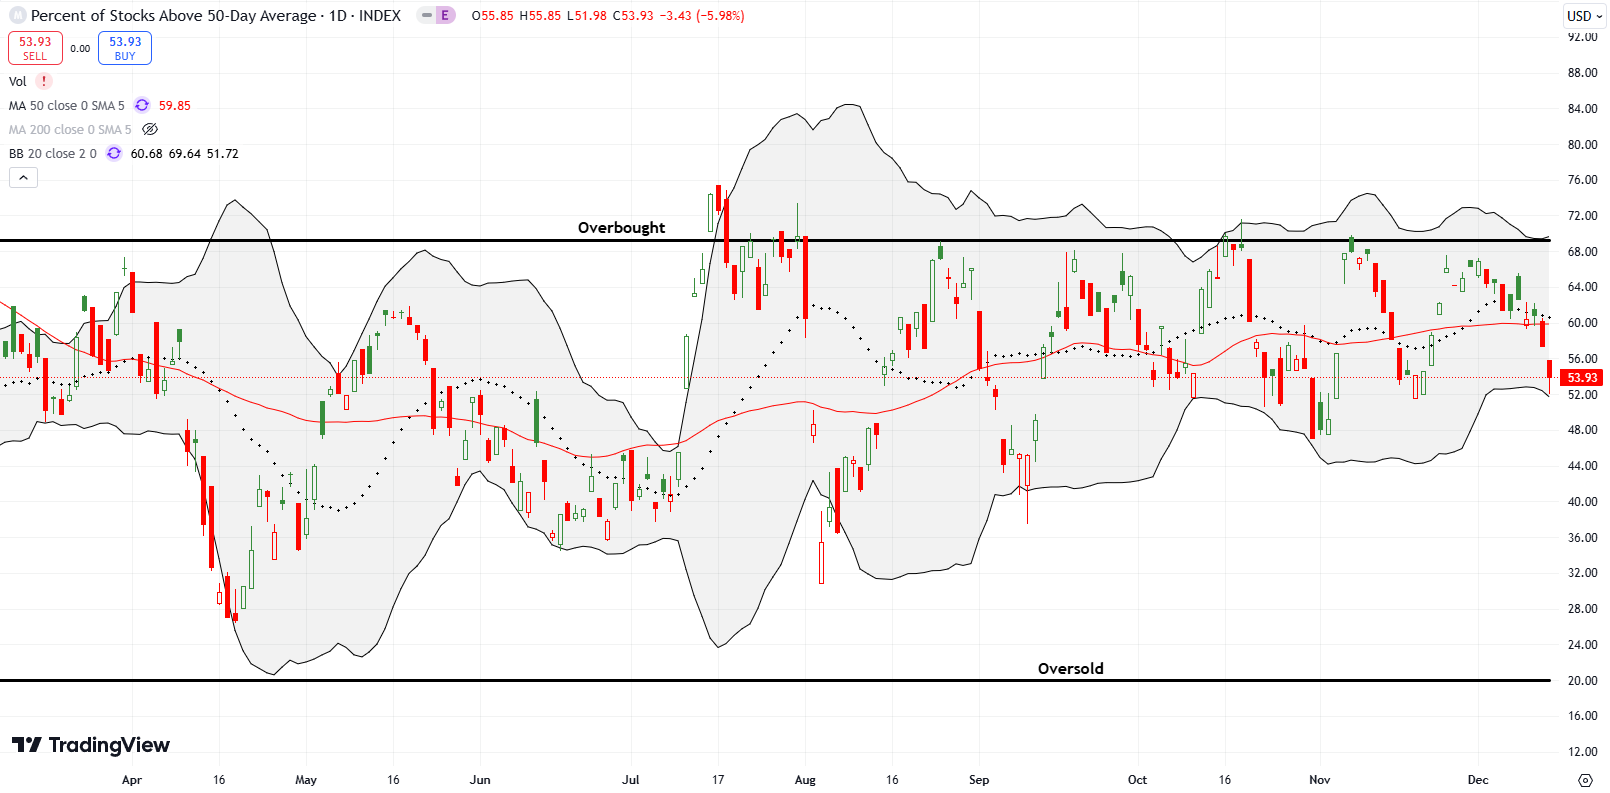
- AT50 (MMFI) = 53.9% of stocks are trading above their respective 50-day moving averages
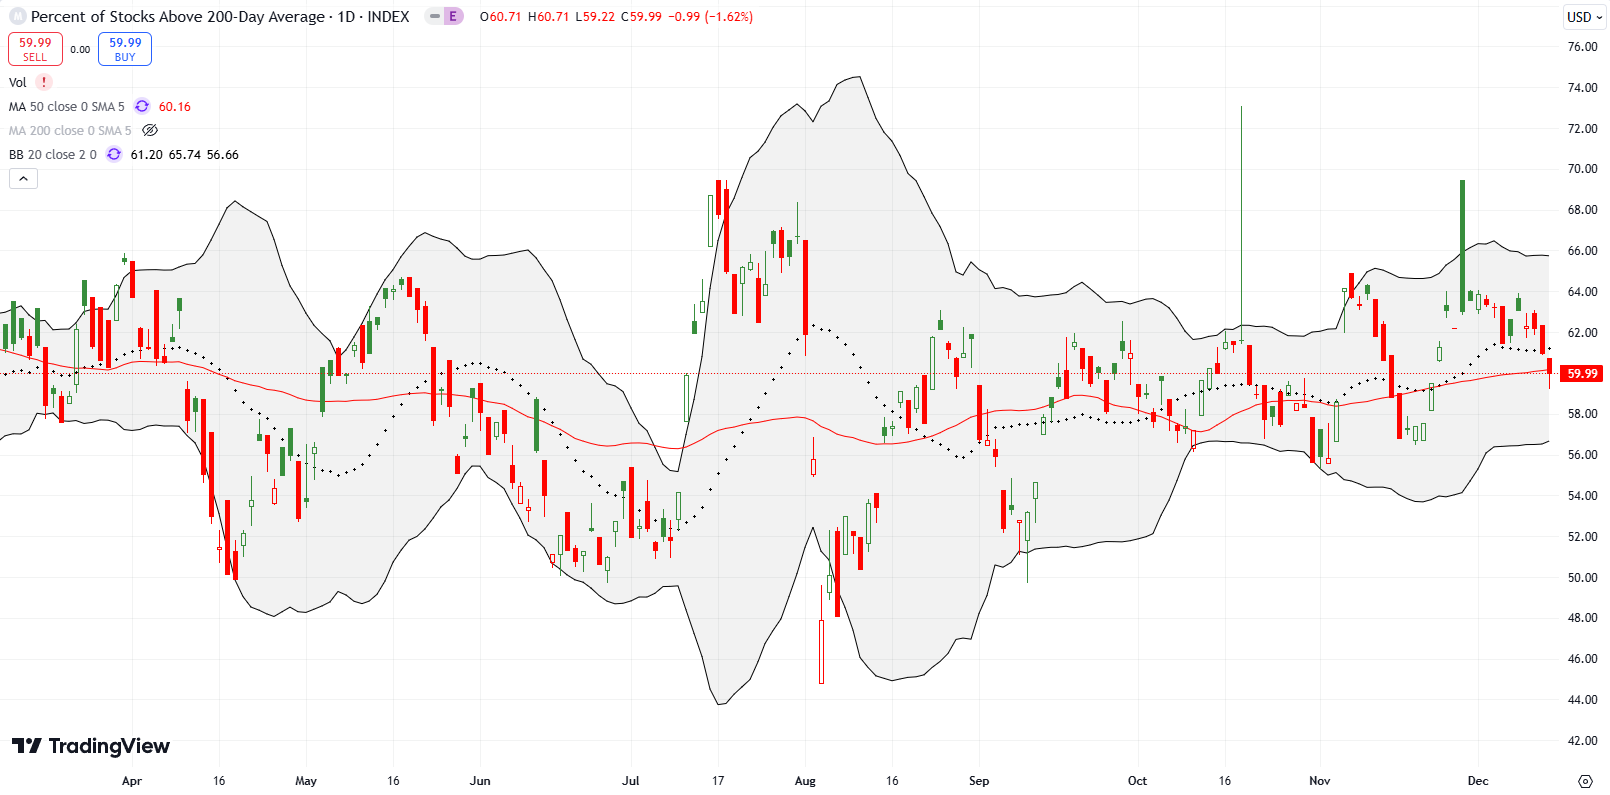
- AT200 (MMTH) = 60.0% of stocks are trading above their respective 200-day moving averages
- Short-term Trading Call: neutral
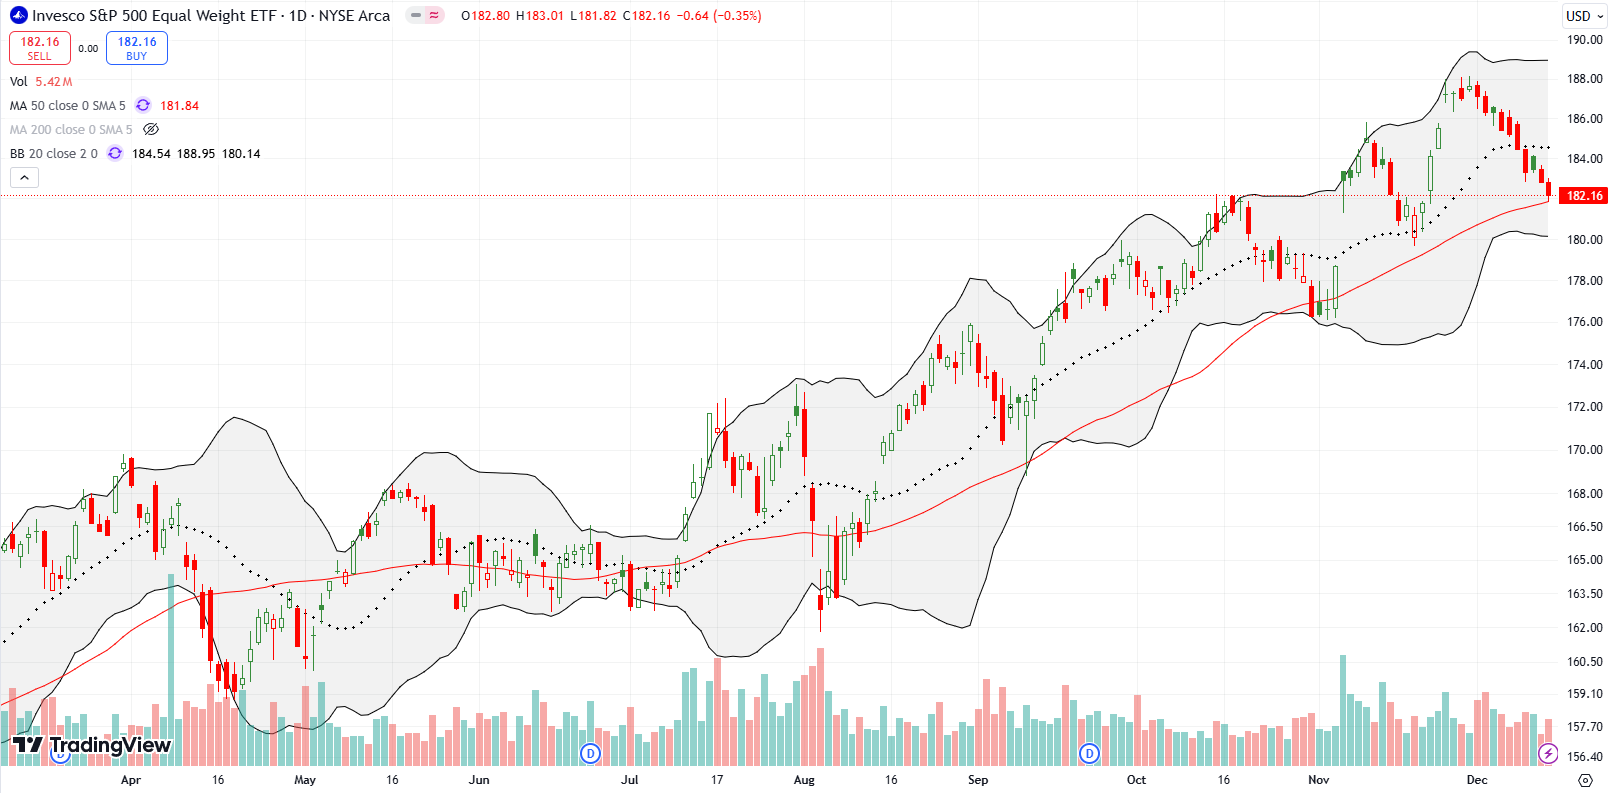
AT50 (MMFI), the percentage of stocks trading above their respective 50DMAs, closed the week at 53.9%. My favorite technical indicator suffered a market breadth breakdown the last two days of the week. AT50 fell from 60.9% in a move that should have signaled a bearish swing in momentum. Moreover, small caps lost big for the week, and the Invesco S&P 500 Equal Weight ETF (RSP) lost 1.6% for the week. In fact, RSP has accompanied IWM down all month. This divergence gets more interesting as a bearish signal if RSP confirms a 50DMA breakdown which presumably would drag AT50 lower. RSP last suffered a confirmed 50DMA breakdown in April.
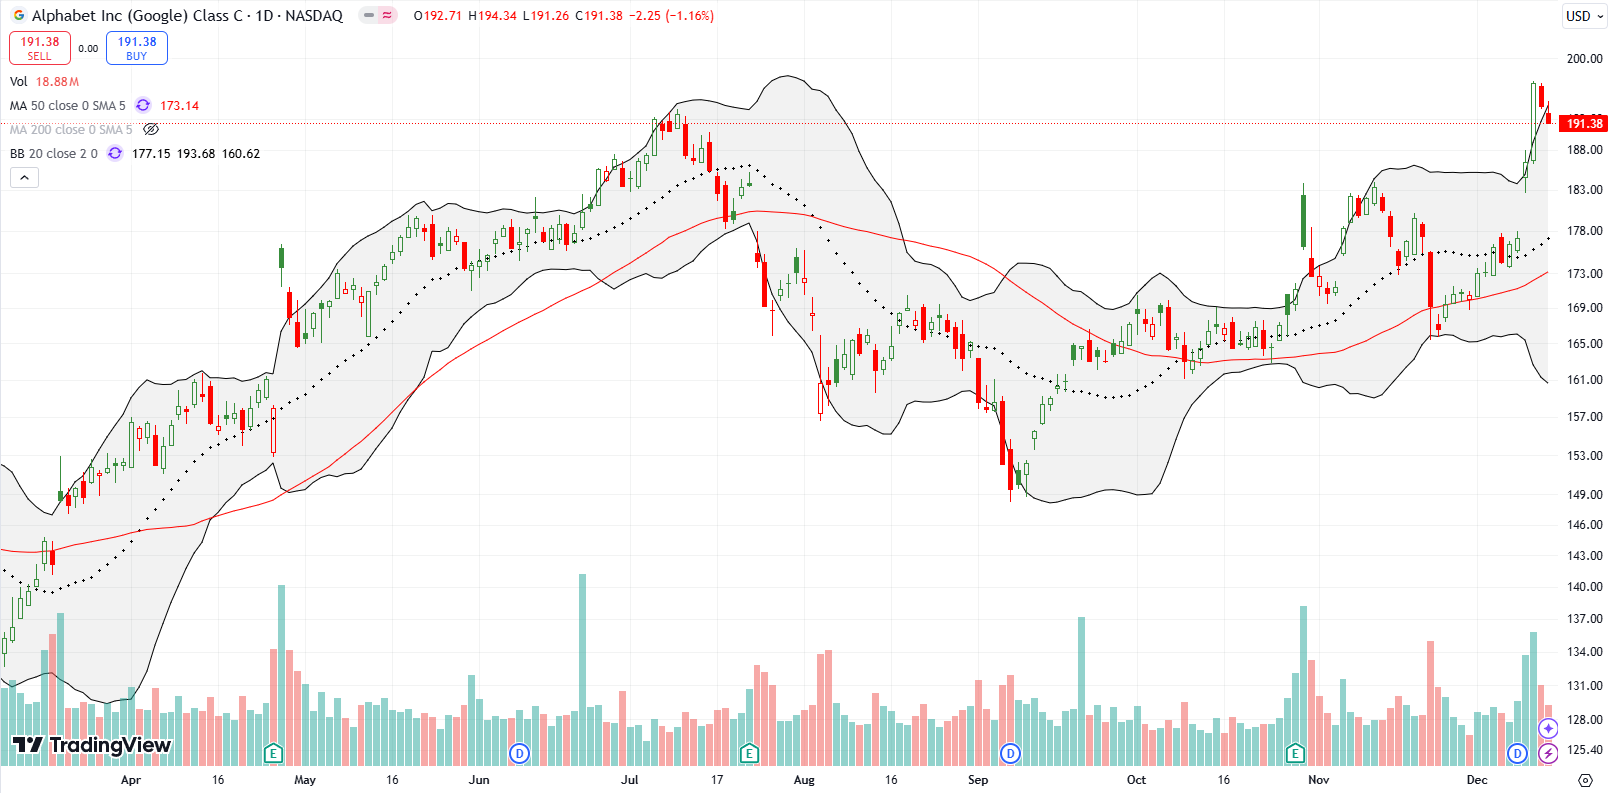
Alphabet Inc (GOOG) was one of the high tech stars that pushed the NASDAQ higher. GOOG took a literal quantum leap as it announced a quantum computing breakthrough. I had no idea Alphabet was toiling away on quantum computing. Suddenly, GOOG climbs the flagpole of my generative AI plays given the resurgent strength of the stock and the dreams of traders looking at the possibilities for supercharging generative AI with high-powered computing.
After GOOG gapped higher on Tuesday, I immediately jumped into a calendar call spread. The next day’s buying follow-through took my position out at the initial profit target. Toward the close, I bought a new calendar call spread at the $200 strike. So I go into the coming week with a long GOOG $200 weekly call. I have been a big fan of quantum computing stocks for over a year, so I am intrigued by GOOG jumping into the mix.
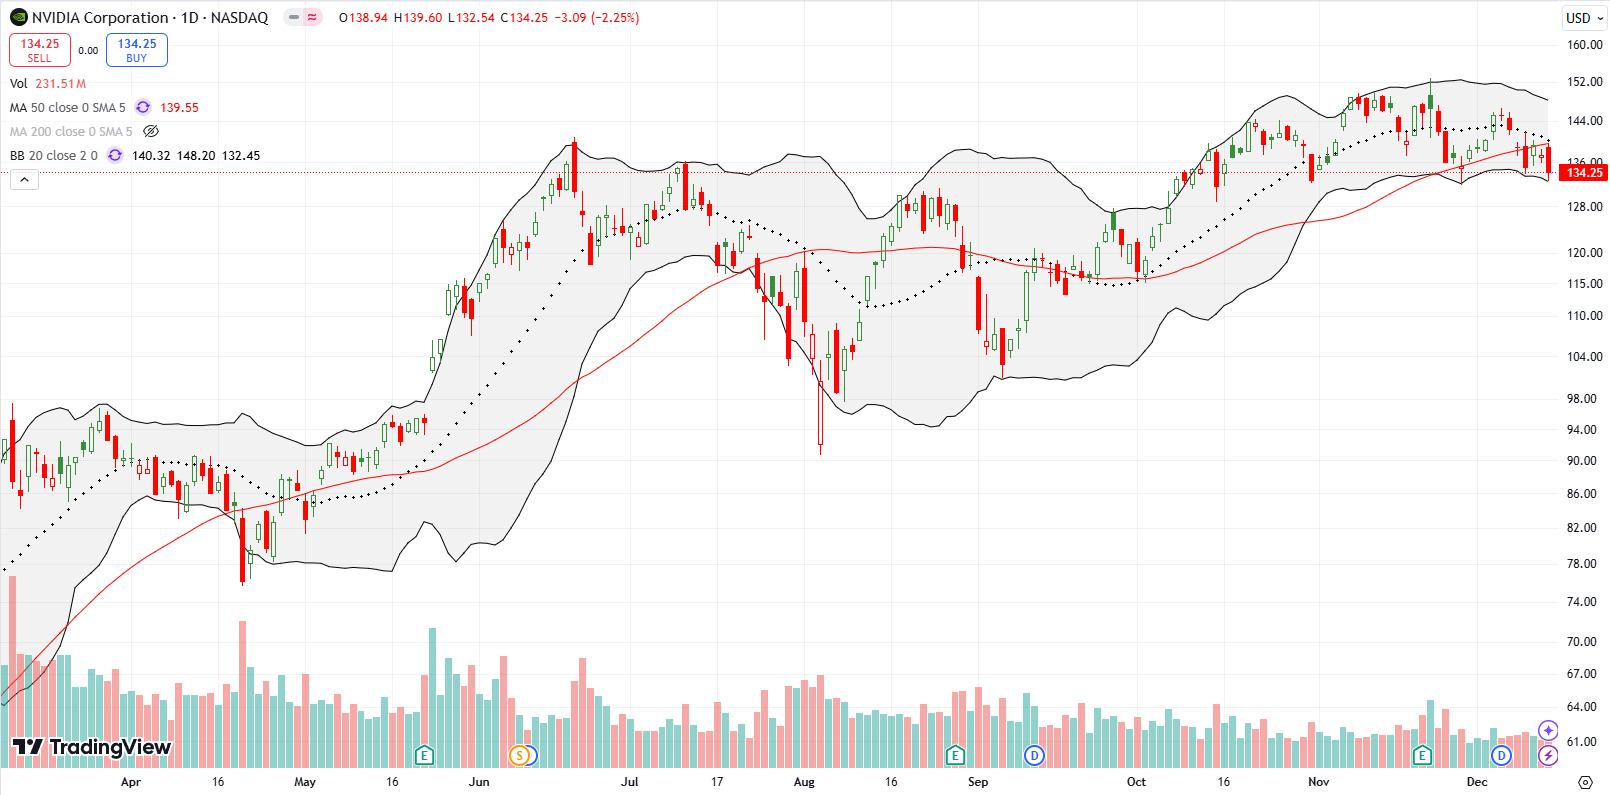
While tech had a good week, NVIDIA Corporation (NVDA) is looking toppy again. NVDA’s 20DMA is turning downward as the stock confirmed a 50DMA breakdown with a 2.3% loss on Friday. If you stare really closely, you can see a head and shoulders top. However, NVDA is not a short unless/until it closes below the October 15th close at $131.60. Such a close would create the rare confirmation of a head and shoulders top. Still, recall that NVDA began a major run-up after a head and shoulders fake out in the second half of 2023.
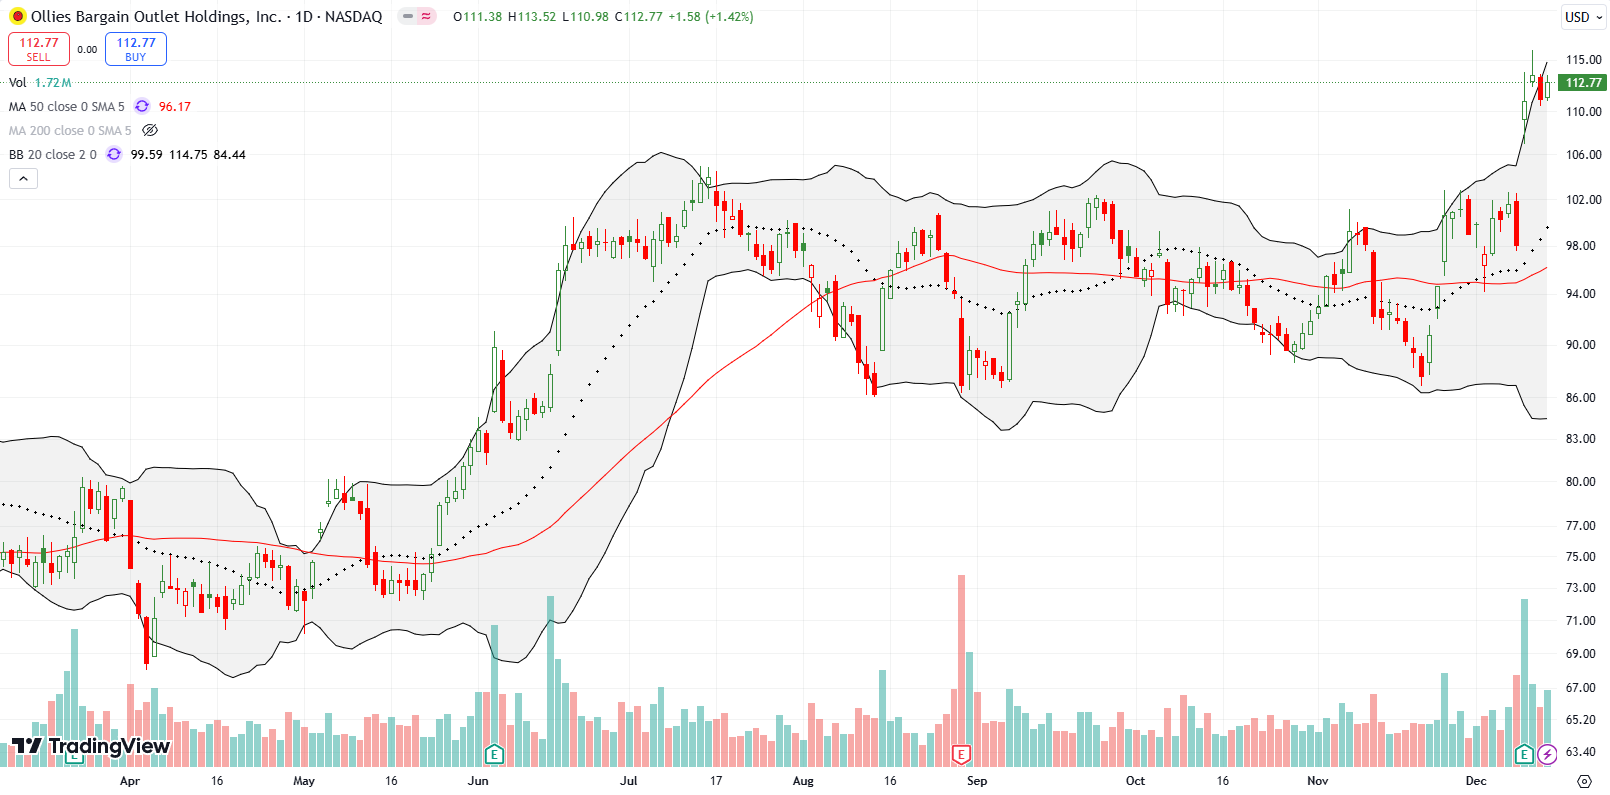
Discount retailer Ollie’s Bargain Outlet Holdings, Inc (OLLI) broke out to an all-time high after a 13% post-earnings pop. With other discount retailers doing poorly this year, OLLI stands out as an attractive breakout buy even amid the market breadth breakdown.
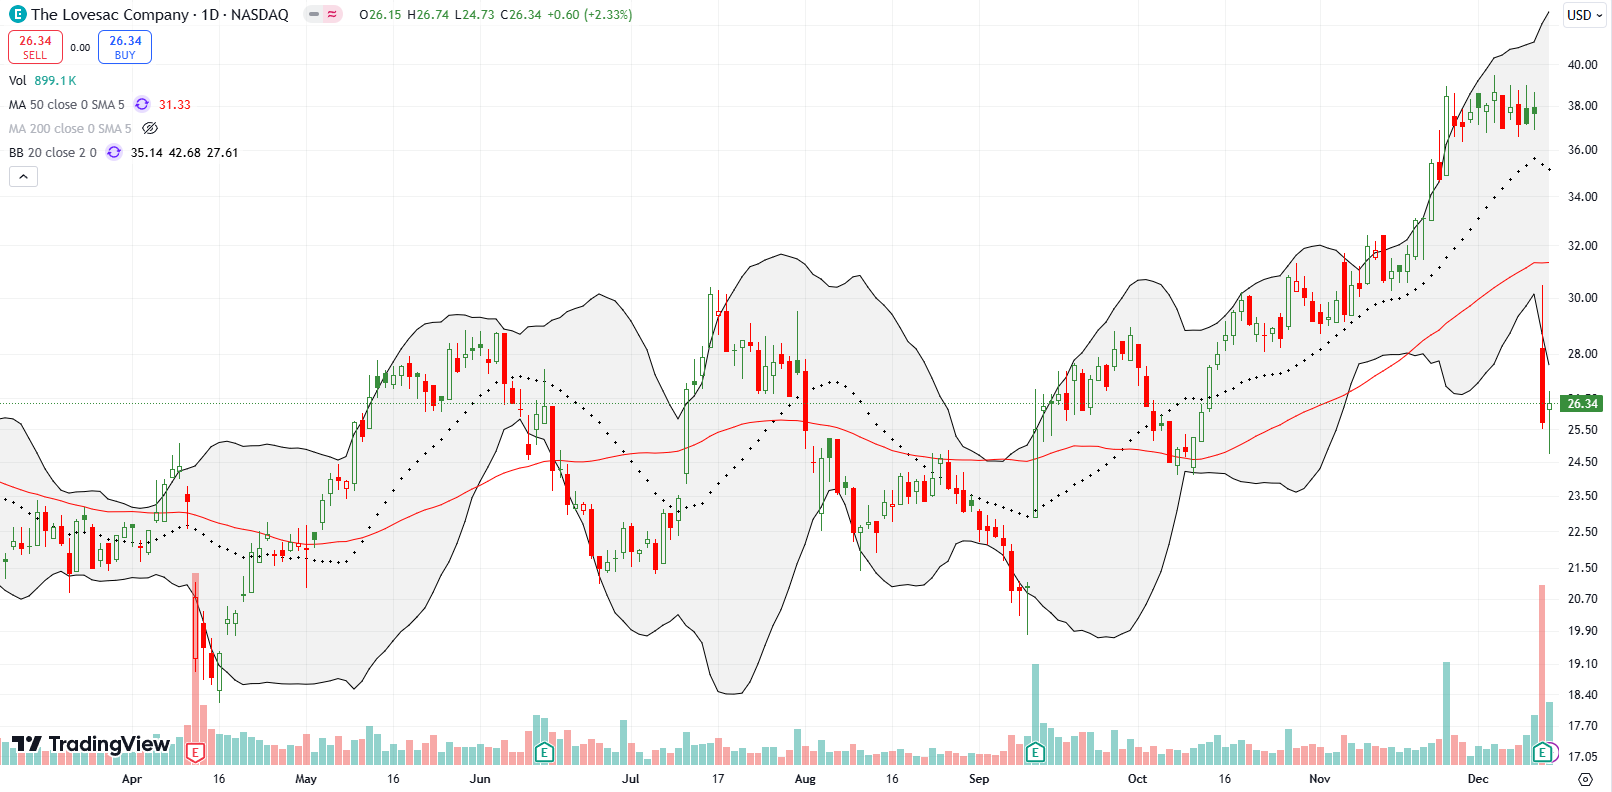
Furniture-maker The Lovesac Company (LOVE) seemed setup for a fail given the waning performance of housing-related stocks. I placed a hedged pre-earnings options trade and ended up far under-estimating the post-earnings collapse. LOVE crashed 31.7% post-earnings with a clean 50DMA breakdown. Friday’s rebound from inrtaday lows has the look of an attempted stabilization.
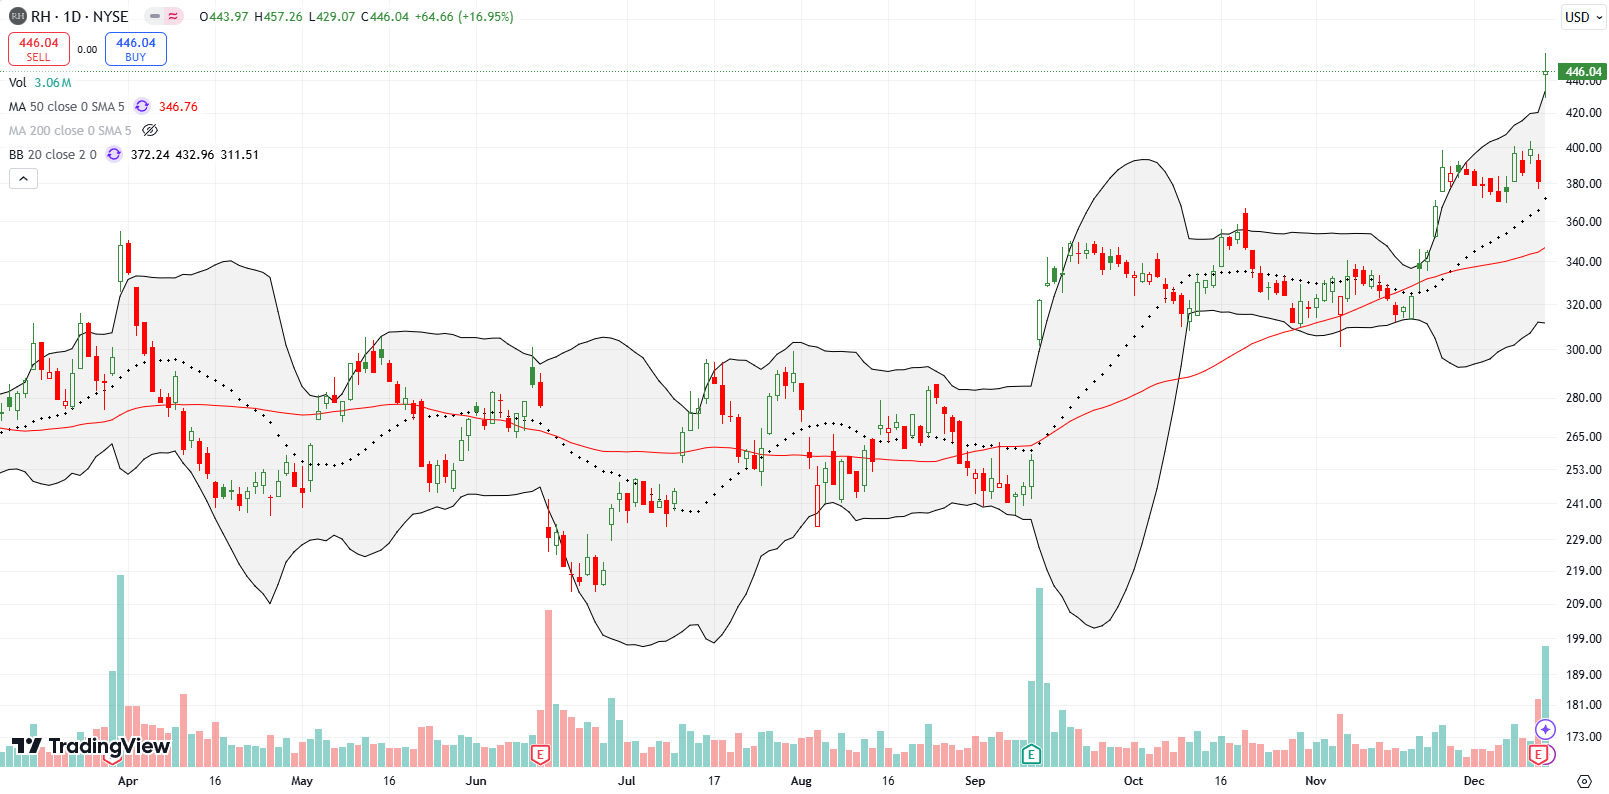
Filled with the success of going after LOVE, I went after home furnishing retailer RH (RH) (formerly Restoration Hardware) with an unhedged pre-earnings put option position. A 17.0% post-earnings pop to a 2-year high wiped out that position and provided another lesson in the perils of over-confident trading!
Be careful out there!
Footnotes
Subscribe for free to get email notifications of future posts!
“Above the 50” (AT50) uses the percentage of stocks trading above their respective 50-day moving averages (DMAs) to measure breadth in the stock market. Breadth defines the distribution of participation in a rally or sell-off. As a result, AT50 identifies extremes in market sentiment that are likely to reverse. Above the 50 is my alternative name for “MMFI” which is a symbol TradingView.com and other chart vendors use for this breadth indicator. Learn more about AT50 on my Market Breadth Resource Page. AT200, or MMTH, measures the percentage of stocks trading above their respective 200DMAs.
Active AT50 (MMFI) periods: Day #265 over 20%, Day #164 over 30%, Day #88 over 40%, Day #26 over 50% (overperiod), Day #2 under 60% (underperiod), Day #103 under 70%
Source for charts unless otherwise noted: TradingView.com
Full disclosure: long SPY put spread, long IWM shares and call options, long QQQ put spread, long GOOG call, short and long LOVE puts
FOLLOW Dr. Duru’s commentary on financial markets via StockTwits, BlueSky, and even Instagram!
*Charting notes: Stock prices are not adjusted for dividends. Candlestick charts use hollow bodies: open candles indicate a close higher than the open, filled candles indicate an open higher than the close.


My friend: I consumed your Sunday missive on Monday. Picked up on the topping action Tuesday and dramatically reduced position going into Wednesday AM. I was expecting losses early Wednesday AM. However. the increased buying before lunch seemed to give the all clear nod that “all good” with leaders recovering their moving averages. The day appeared to be another yuan so I walked away from not returning until minutes before the close. Wow, that was a bit violent inflamed by multiple stops. Hope all worked out for you. Be careful out there.
Hey! Long time!
The long-term portfolios took a righteous beating of course. But also I am astounded by where they are (were) in the first place. The short-term trades worked out great, particularly given I was able to watch the market most of the day. Not to mention I went into the Fed meeting with this nagging bearish divergence on my mind…