Stock Market Commentary
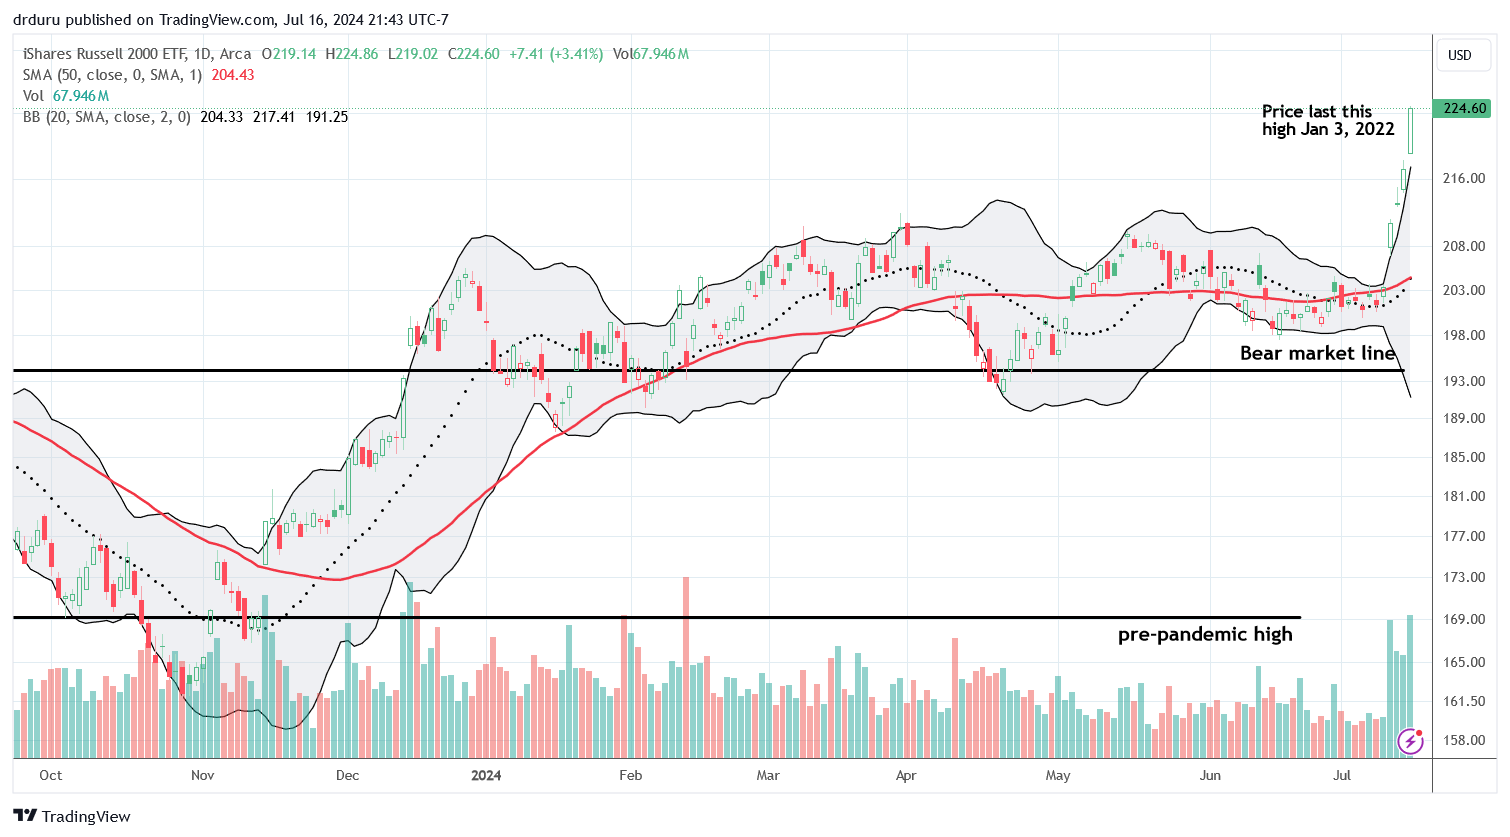
The NASDAQ is still toppy, but no matter. Small cap stocks are playing the role of super hero. They made a major statement helping to drive market breadth into overbought conditions. These tiny tots turned super hero in historic fashion.
Talk about igniting overbought conditions in style! Forget all that talk about big cap tech and growth stocks sucking all the oxygen out the market and dominating its gains. In an instant, IWM is up 11.9% year-to-date and closing in on the S&P 500 and its 18.8% year-to-date gains. However, and needless to say, such an historic extreme invites pushes my contrarian mind into overdrive. Such a move hardly looks sustainable. Yet, the bears have been particularly ineffective this year; they are an unreliable crew for restoring balance through reversions to the mean. The bulls own this market more than ever.
The Stock Market Indices
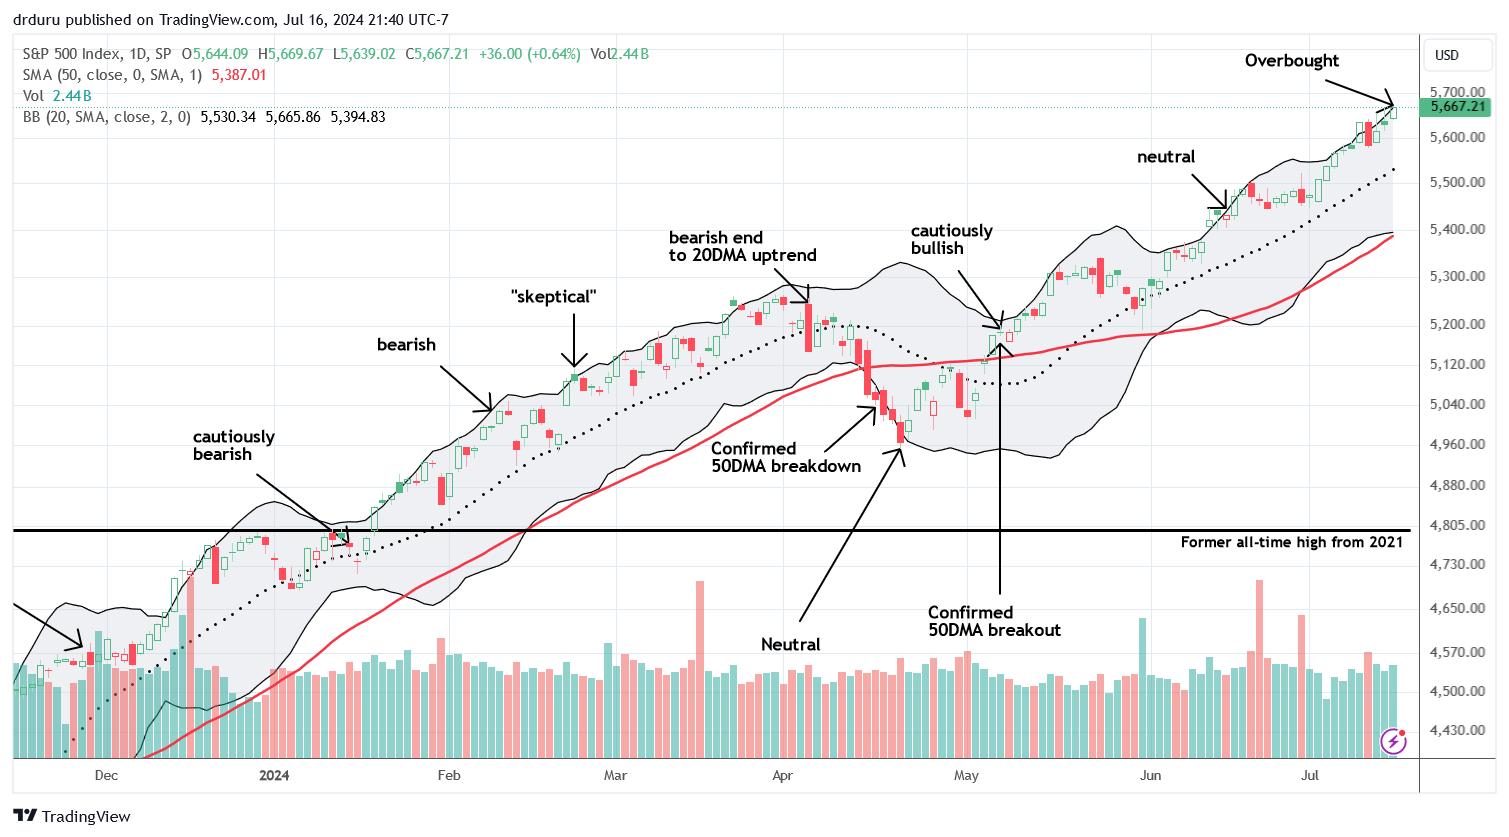
The S&P 500 (SPY) plodded along and contributed to the overbought celebration with a marginal new all-time high. As expected, the index readily invalidated last week’s bearish engulfing pattern. The rally along the upper Bollinger Band (BB) continues. The chart below shows how the persistent and astounding rally since October has defied changing technical calls: just buy, buy, buy…
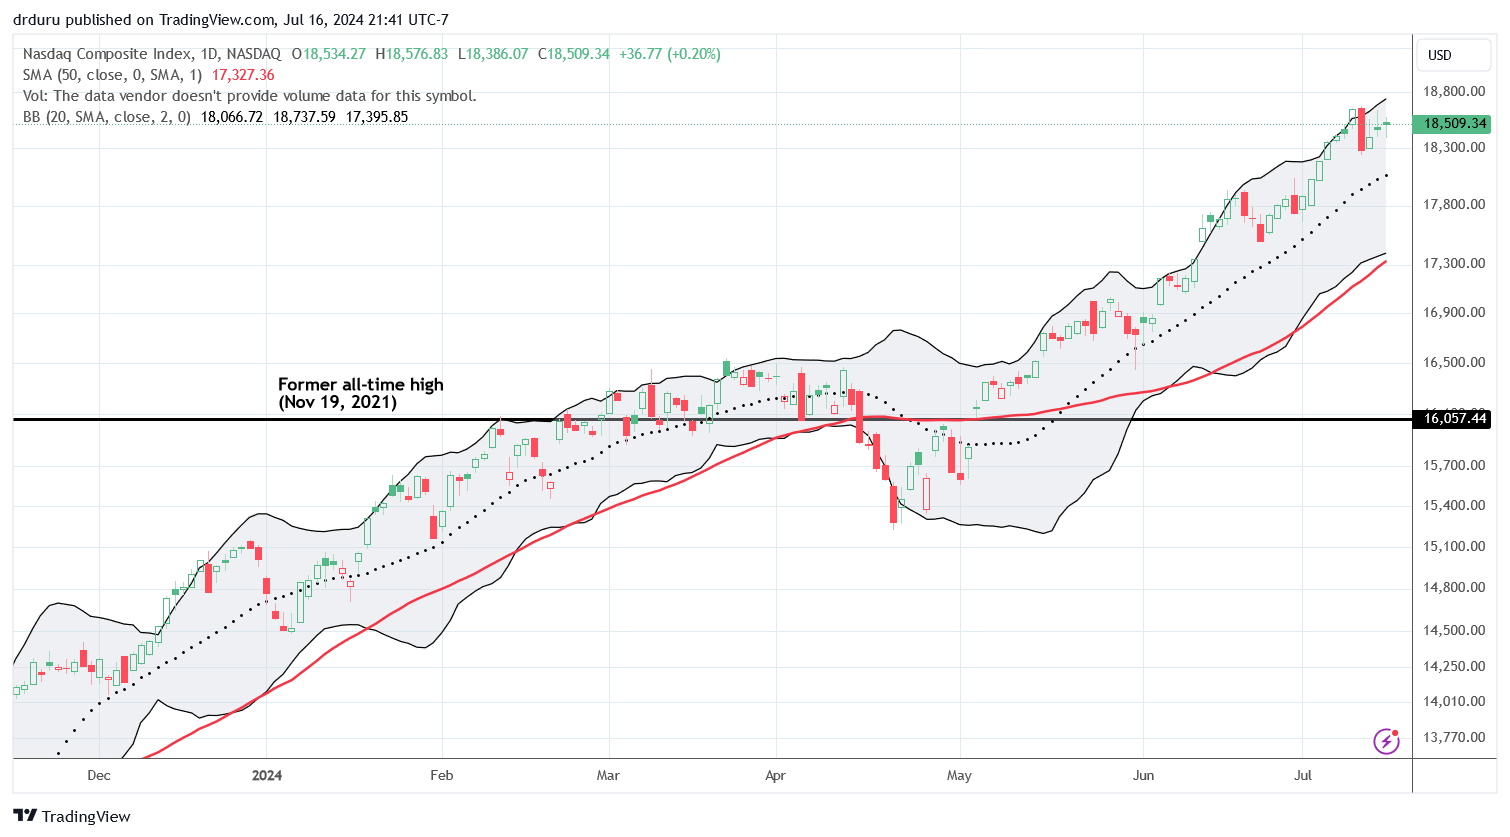
The NASDAQ (COMPQ) took a step into the shadows of the day’s overbought celebration. The tech-laden index barely closed with a gain and could not even invalidate its bearish engulfing topping pattern. However, given the weakness of the bears, I strongly suspect the NASDAQ will eventually overcome this latest hurdle in due time, rotation or no rotation.
The iShares Russell 2000 ETF (IWM) was a big winner last week and an astounding winner so far this week. Given IWM looked stretched last Friday, it never even occurred to me to refresh my trade on IWM call options. Fortunately, the historic nature of this move helps me avoid feeling bad for missing this price action. Market breadth trading is about reacting against extremes and not predicting or anticipating them.
IWM has gone parabolic, so I am even less interested in going long here. All I can do is watch and wait to see how this parabolic move cools off.
The Short-Term Trading Call With Overbought
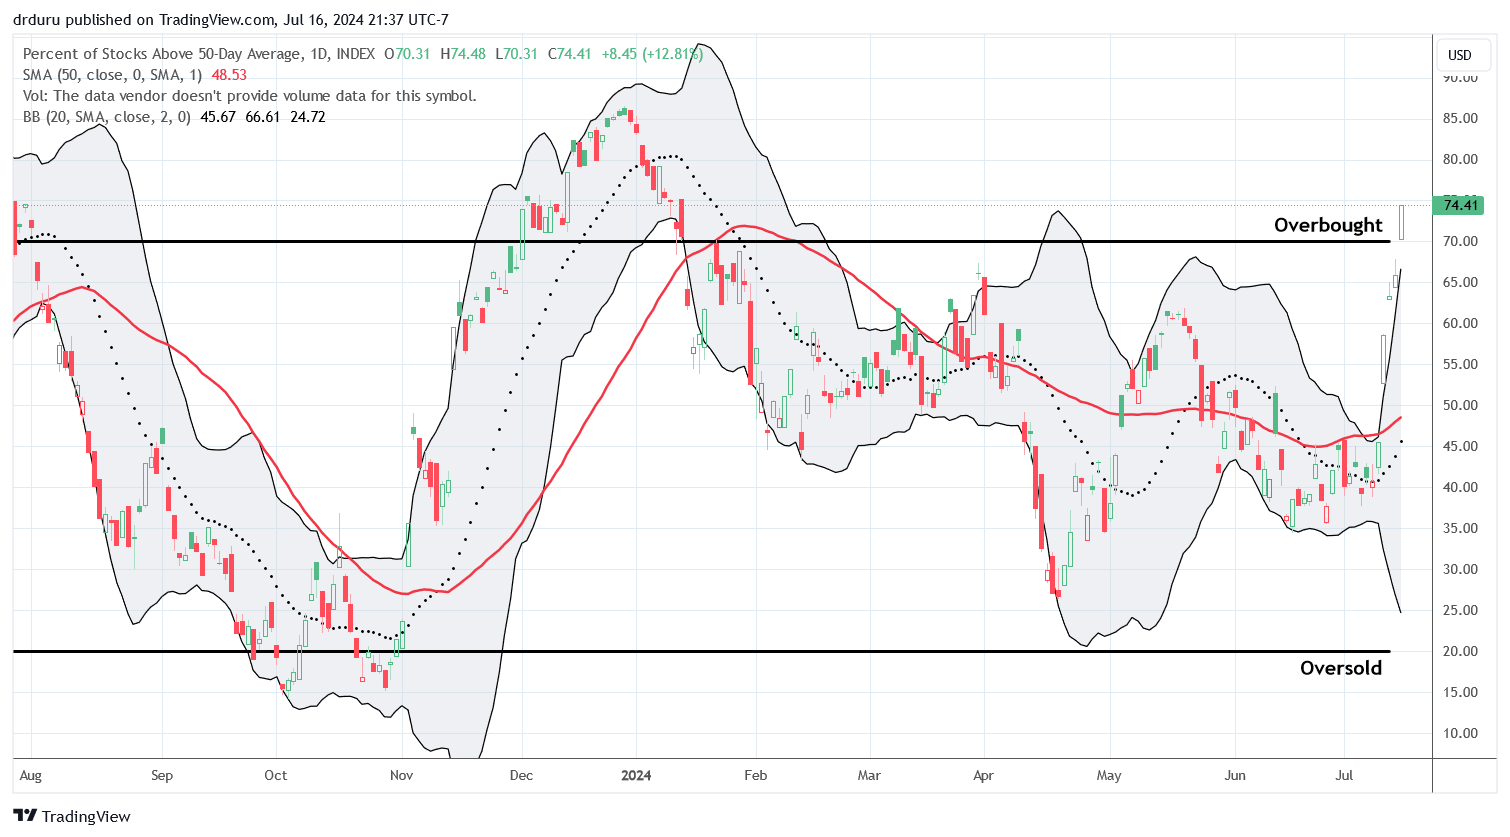
- AT50 (MMFI) = 74.4% of stocks are trading above their respective 50-day moving averages
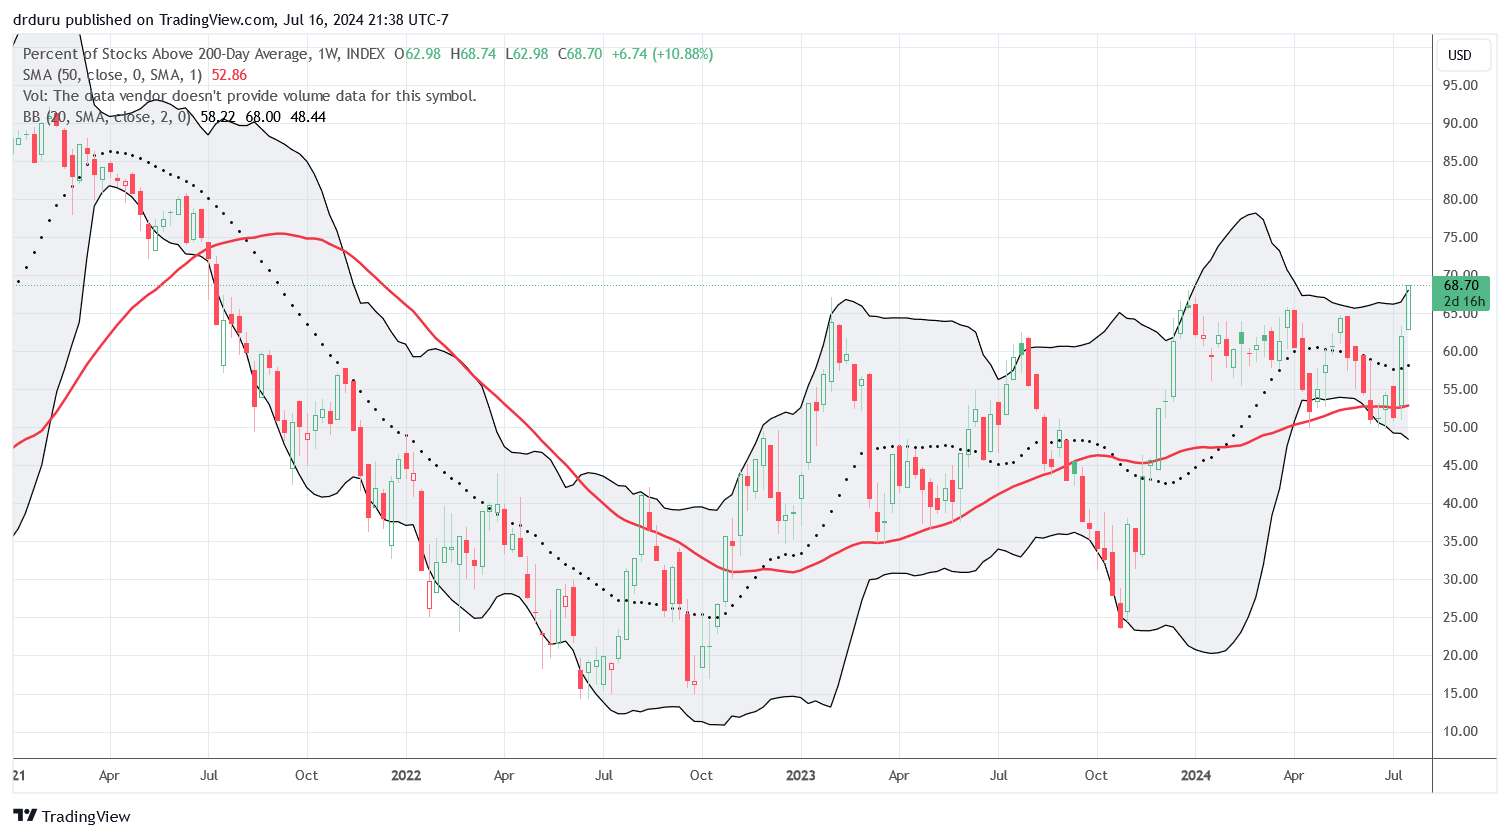
- AT200 (MMTH) = 68.7% of stocks are trading above their respective 200-day moving averages
- Short-term Trading Call: neutral
AT50 (MMFI), the percentage of stocks trading above their respective 50DMAs, surged eight and a half percentage points to enter overbought conditions for the first time in 6 months. AT200 (MMTH), the percentage of stocks trading above their respective 200DMAs, was even more impressive. This indicator of longer-term market breadth soared to a 3-year high. Thus, even after this overbought period ends, I will have a very hard time getting bearish per the AT50 trading rules. When I do get bearish, I expect to trade in a very tight window of time!
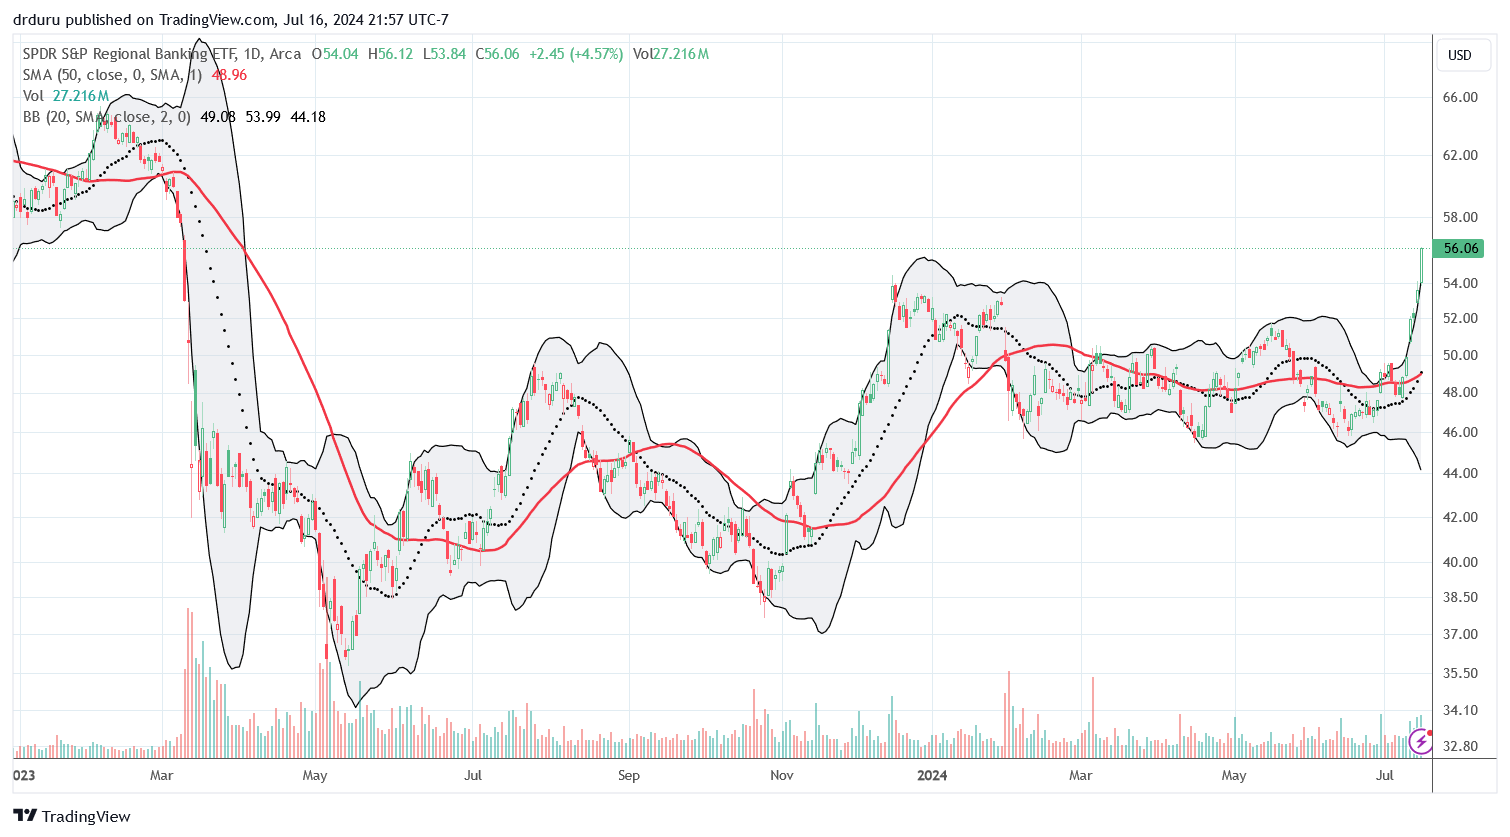
IWM is full of financial stocks. Thus it makes sense that in parallel to IWM’s surge, the SPDR S&P Regional Banking ETF (KRE) is up 14.9% since breaking out above its 50DMA. This 5-day run-up has nearly finished the job that the November to December run-up almost accomplished: a complete reversal of the 2023 crash.
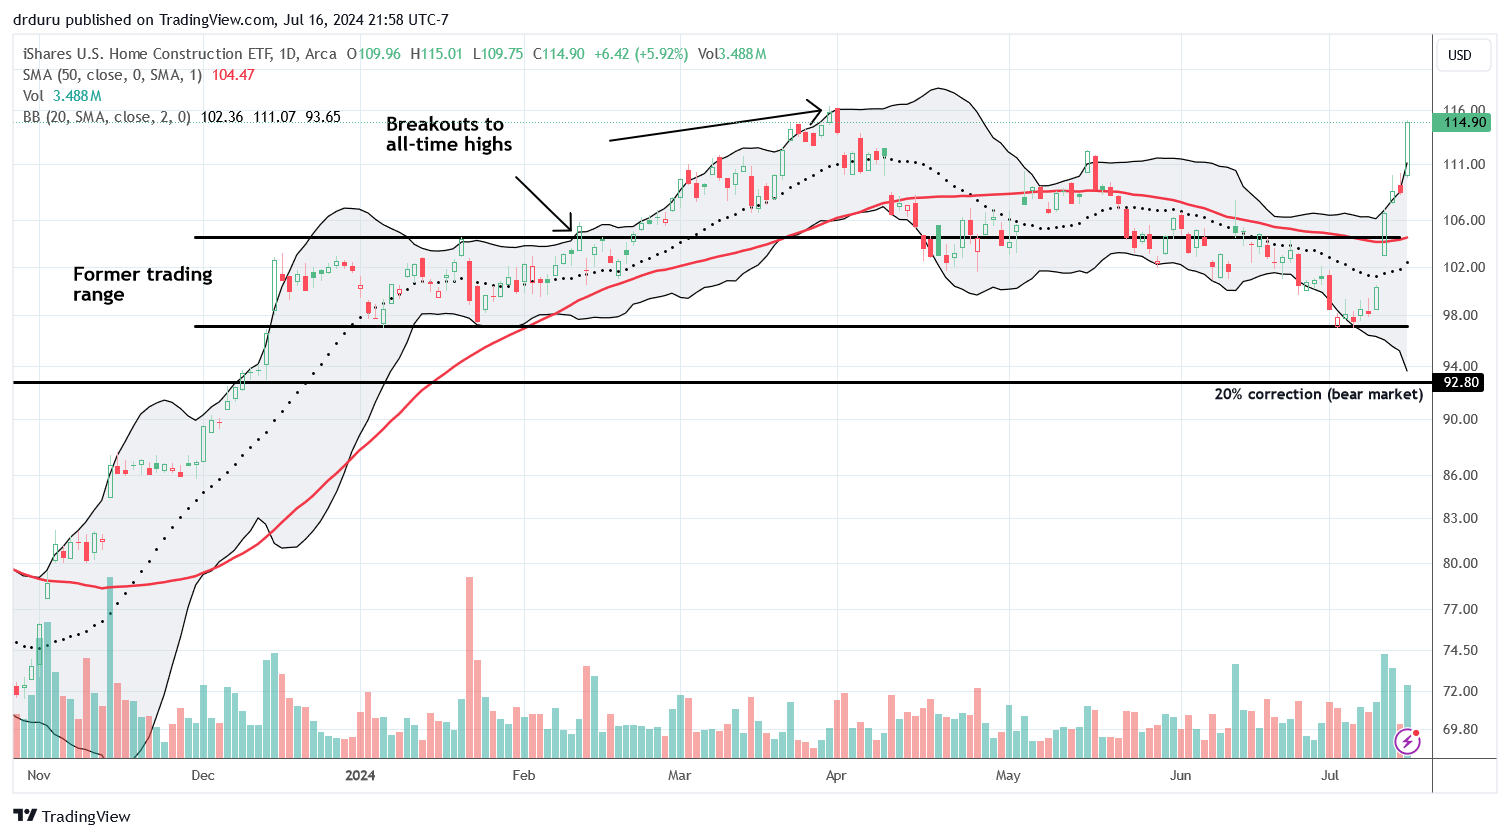
So much for getting a chance to buy home builders in the extreme of a bear market or even buying them for a discount at the start of the seasonally strong period. The big housing downgrade that seemed to confirm my dour assessment of the housing market is practically a distant memory. ITB has run-up in parallel to small caps, propelled by the same enthusiasm anticipating the near certainty of a rate cut in September. ITB almost challenged its all-time high, ironically enough on a day when builder sentiment dropped to a new low for the year. While ITB is clearly over-stretched well above its upper Bollinger Band, I cannot assume ITB will cool off anytime soon given the crush of rotating liquidity engulfing anything and everything not growth and not tech.
Be careful out there!
Footnotes
Subscribe for free to get email notifications of future posts!
“Above the 50” (AT50) uses the percentage of stocks trading above their respective 50-day moving averages (DMAs) to measure breadth in the stock market. Breadth defines the distribution of participation in a rally or sell-off. As a result, AT50 identifies extremes in market sentiment that are likely to reverse. Above the 50 is my alternative name for “MMFI” which is a symbol TradingView.com and other chart vendors use for this breadth indicator. Learn more about AT50 on my Market Breadth Resource Page. AT200, or MMTH, measures the percentage of stocks trading above their respective 200DMAs.
Active AT50 (MMFI) periods: Day #161 over 20%, Day #60 over 30%, Day #7 over 40%, Day #4 over 50%, Day #3 over 60%, Day #1 over 70% (1st overbought day ended 127 days under 70%)
Source for charts unless otherwise noted: TradingView.com
Full disclosure: long SPY put and put spread
FOLLOW Dr. Duru’s commentary on financial markets via StockTwits, Twitter, and even Instagram!
*Charting notes: Stock prices are not adjusted for dividends. Candlestick charts use hollow bodies: open candles indicate a close higher than the open, filled candles indicate an open higher than the close.

