Stock Market Commentary
Last week repeated a familiar story. The S&P 500 and the NASDAQ closed up for the week. Since the October lows, each index has only suffered one down week. The iShares Russell 2000 ETF was part of the party until the calendar flipped to 2024. The ETF of small caps lost altitude for three straight weeks, had one good week, and then declined again. Last week, the bullish truths in the stock market seemed to finally, formally invite small caps to the party. Still, market breadth only made feeble progress. Accordingly, a sharp contrast still exists between the bullish and bearish truths in the stock market. Bears can still growl away even as the bulls taunt them!
The Stock Market Indices
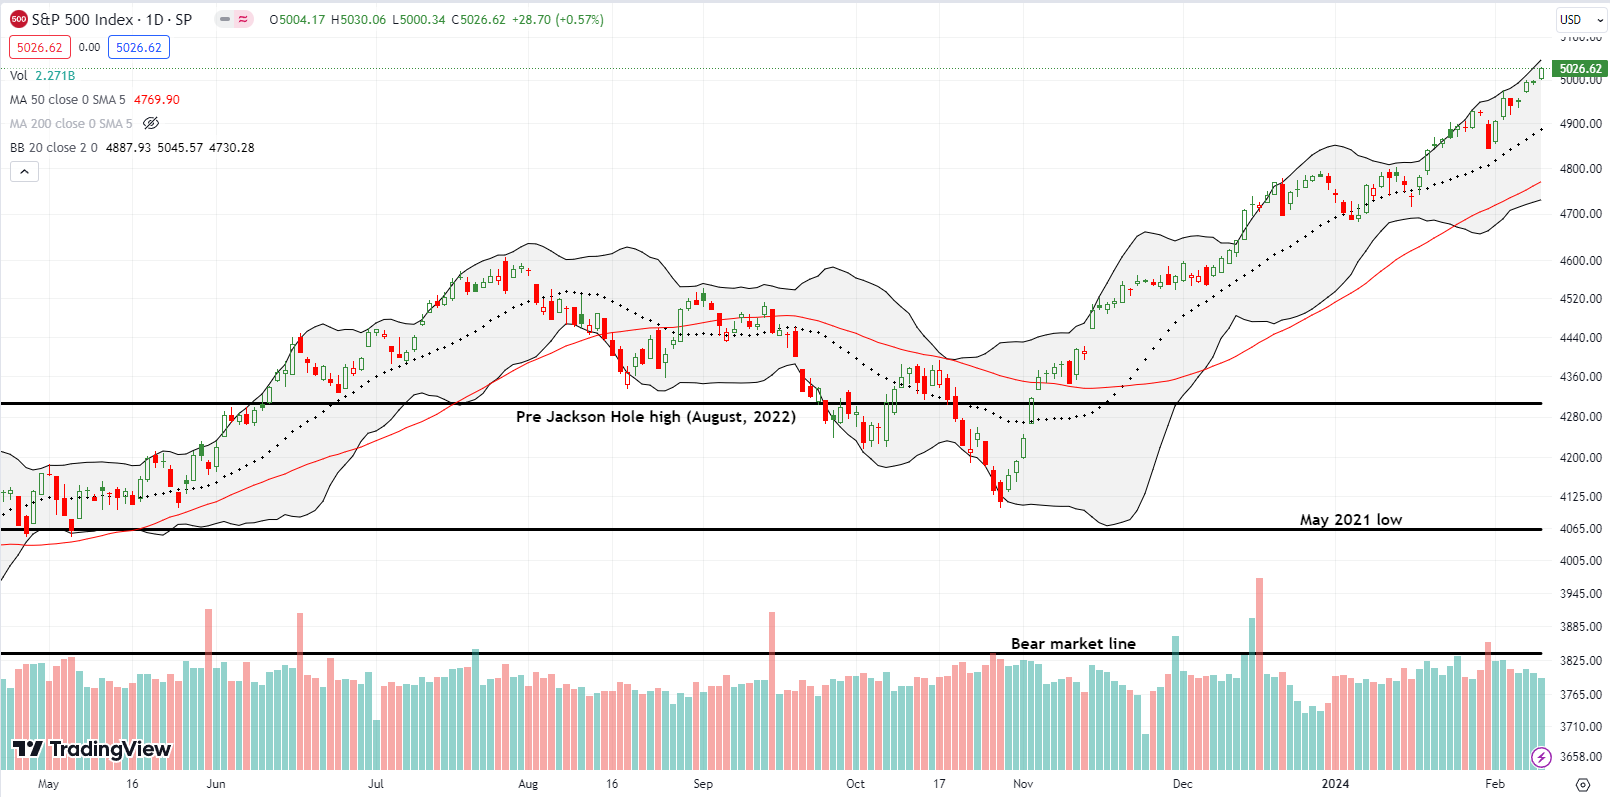
The S&P 500 (SPY) started the week shrinking from its all-time high. The last three days printed new all-time highs with a finish above the 5000 mark. From a technical standpoint, there is no point of natural resistance for the index. It looks free and ready to just keep gliding along the upper Bollinger Band (BB). Bears like me can only look on with reluctant admiration…even as I try to stay mentally ready so I don’t need to get ready for a sell-off (whenever that happens).
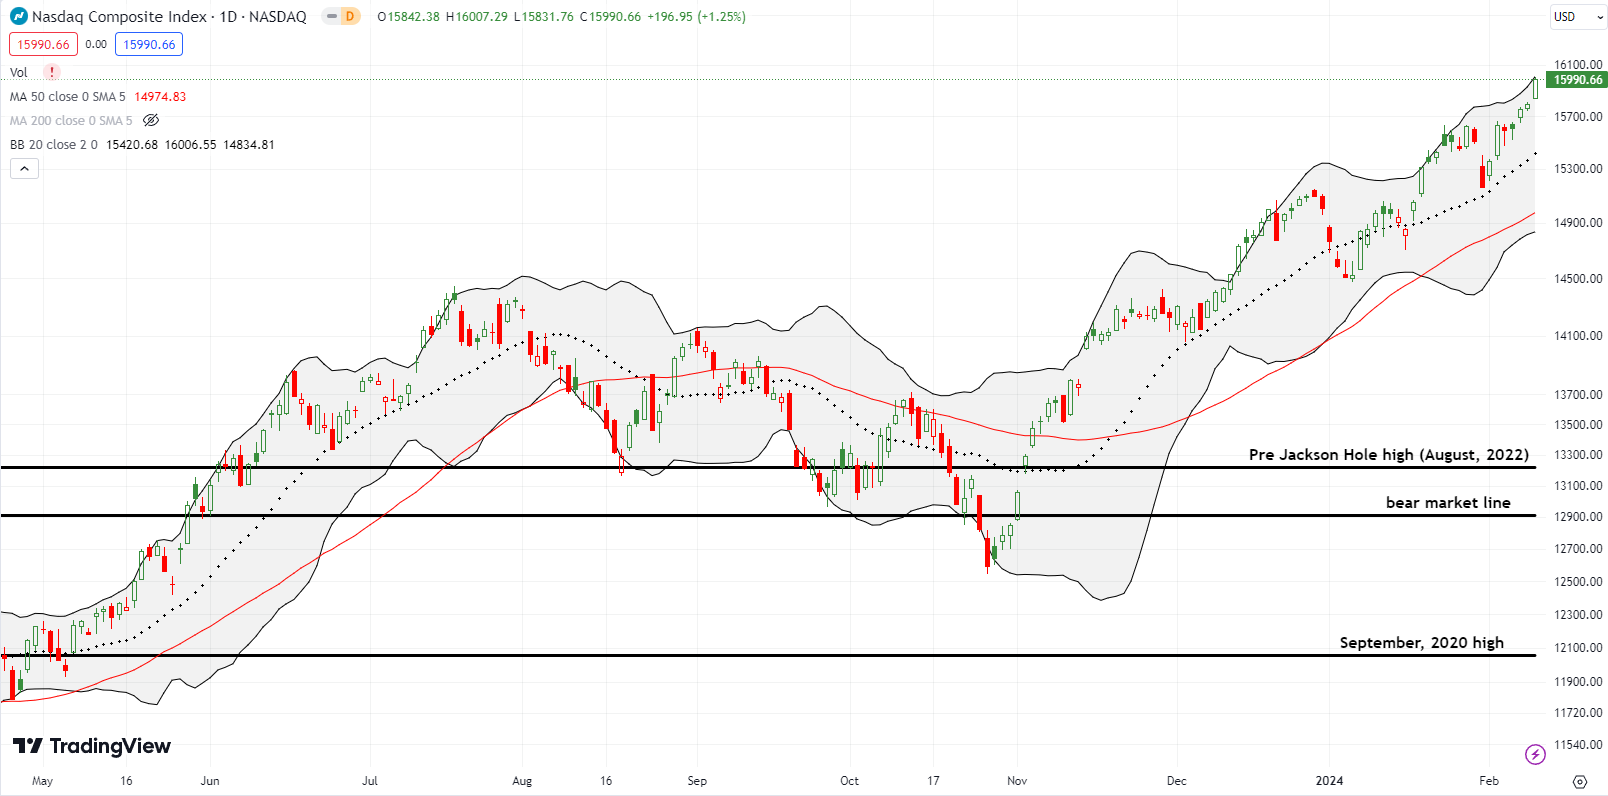
The NASDAQ (COMPQ) accelerated on Friday as if in an effort to catch-up to the S&P 500’s streak of all-time highs. The tech-laden index stopped just short. However, new all-time highs look all but assured. From there, the path of least resistance will continue to look like higher and higher.
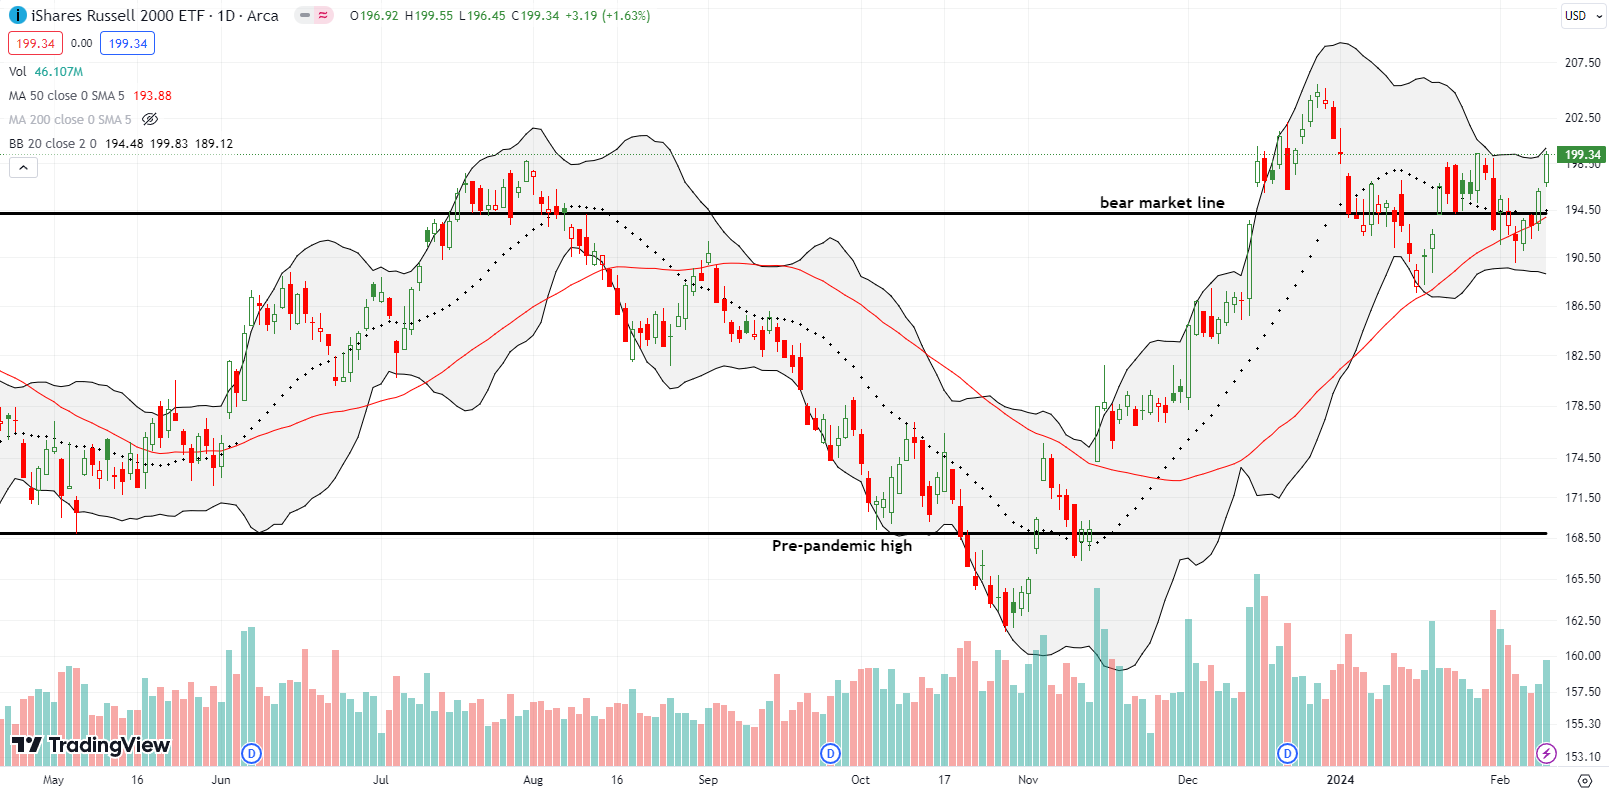
The iShares Russell 2000 ETF (IWM) started the week in bearish territory and ended the week in bullish territory. IWM benefited from its biggest weekly gain in 2 months as bullish truths invite small cap stocks to the party. IWM closed the week right at the previous high with an eye to challenging the 2023 high. A higher close on IWM will force me to retreat a bit to a cautiously bearish short-term trading call. Admittedly, the field of potential shorts shrunk last week with market breadth finally waking up a bit.
I am keeping my IWM put option (the long side of a calendar put spread). However, there will be no point in going after IWM following a breakout.
The Short-Term Trading Call With Bullish Truths
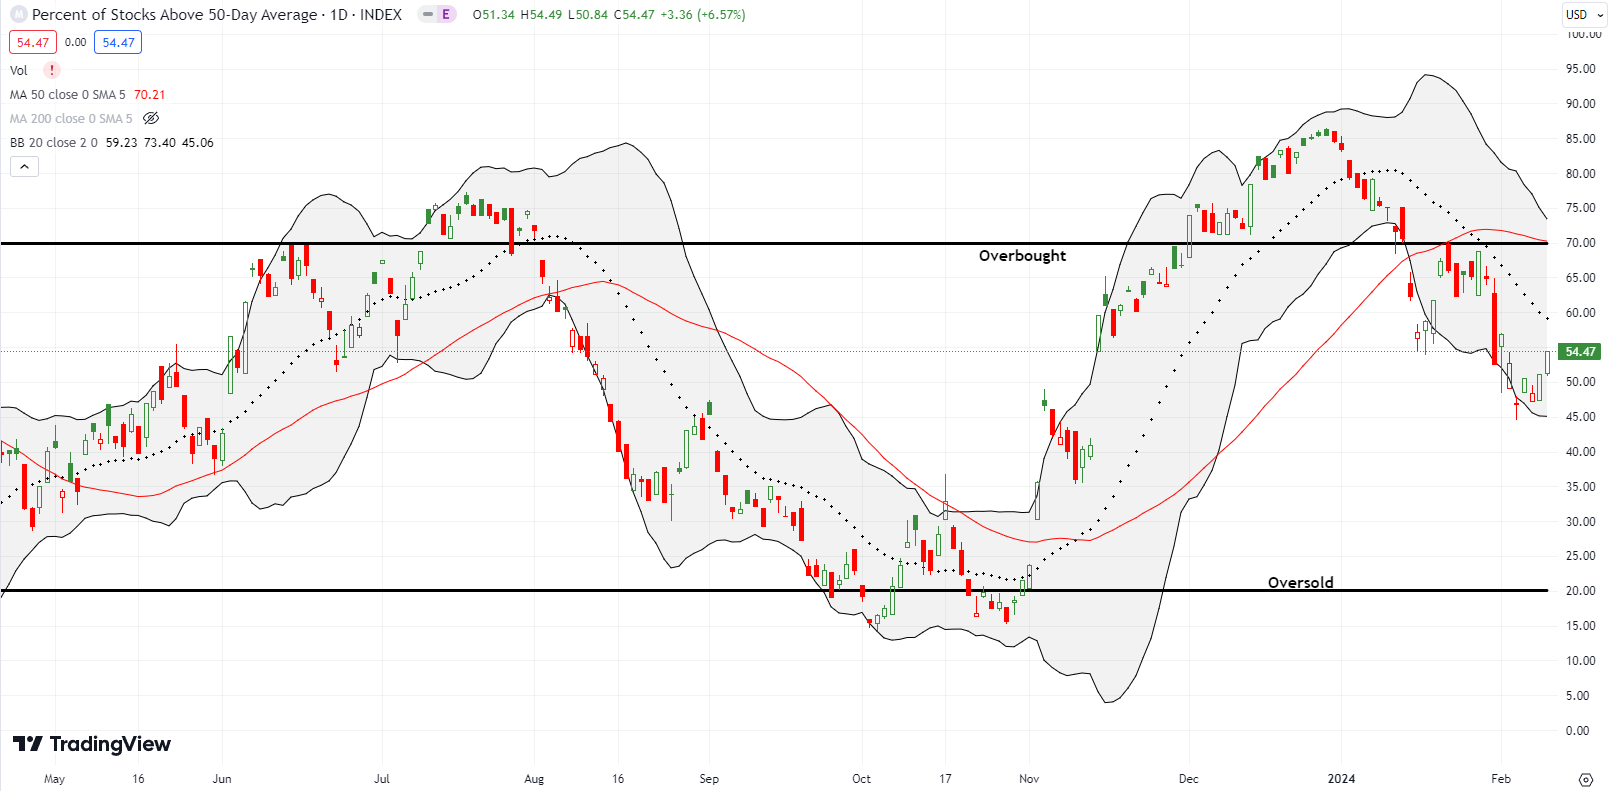
- AT50 (MMFI) = 54.5% of stocks are trading above their respective 50-day moving averages
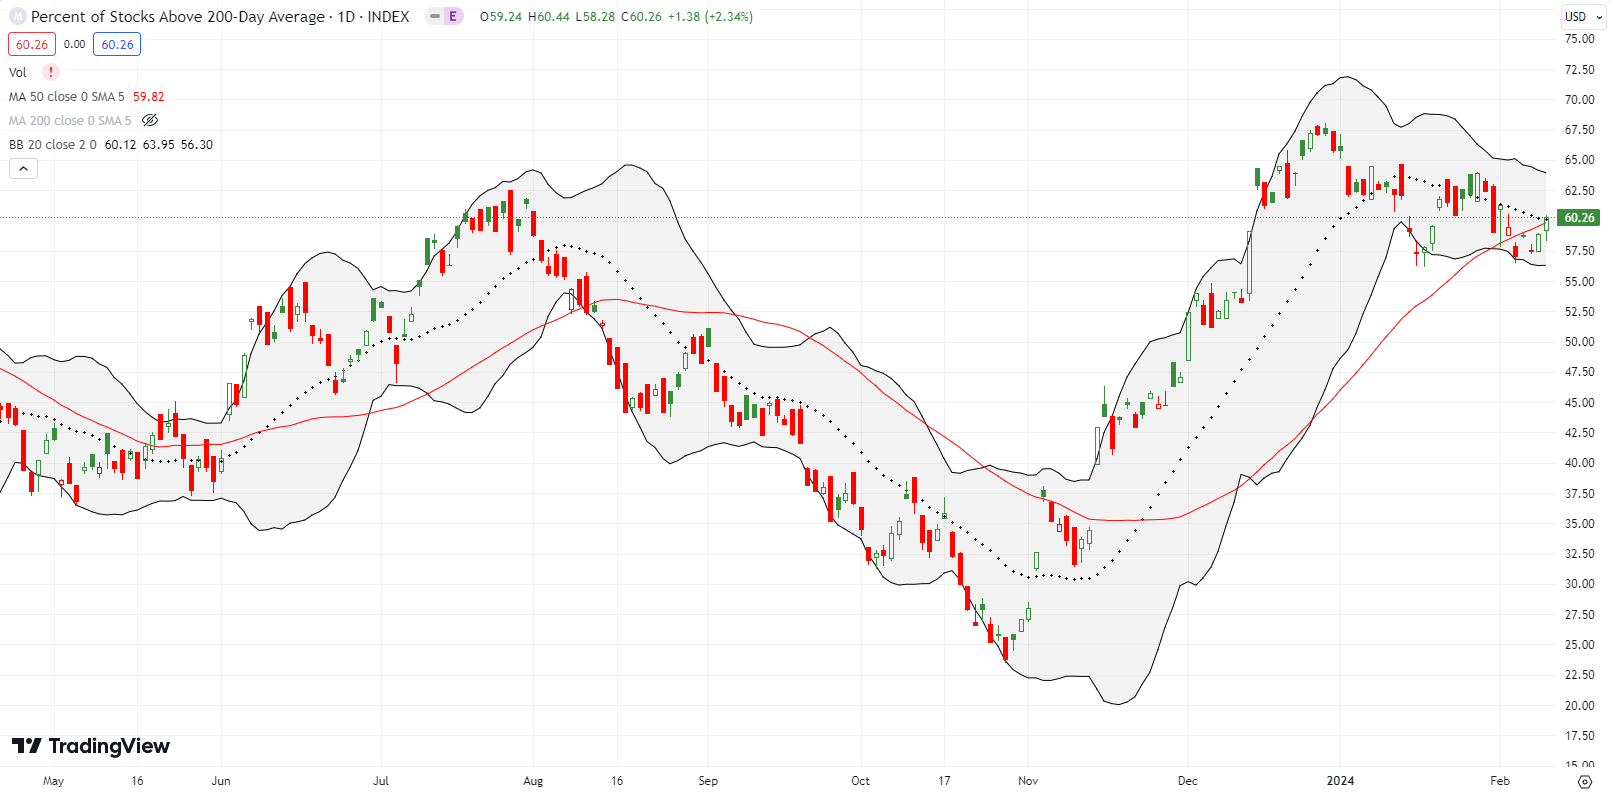
- AT200 (MMTH) = 60.3% of stocks are trading above their respective 200-day moving averages
- Short-term Trading Call: bearish
AT50 (MMFI), the percentage of stocks trading above their respective 50DMAs, closed at 54.5%. My favorite technical indicator gained two straight days for just the second time this year. AT50 is even still in an overall downtrend. Accordingly, the previous bearish signals remain in place. I conceded some ground to the bullish truths in the market by bracing myself for an “upgrade” to the short-term trading call from bearish to cautiously bearish. Still, I realize it would be much more fun to just accept the invite to the party that the bullish truths are extending to the small cap stocks.
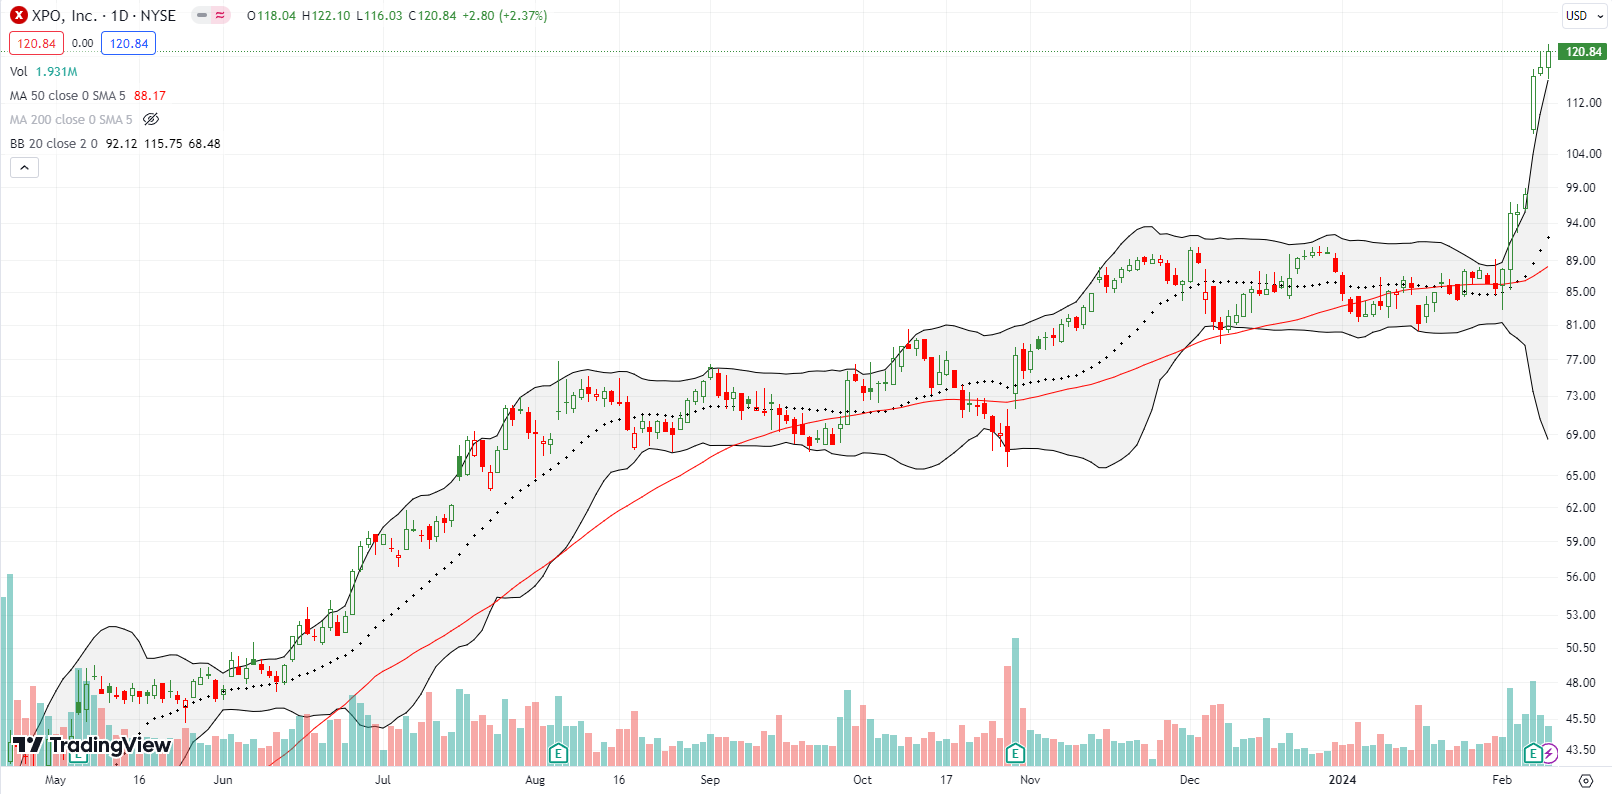
Logistics company XPO, Inc (XPO) had a week oozing with bullish truths. Buyers ran the stock up the flagpole ahead of earnings and continued the party with a skyrocket higher to loftier all-time highs. An 18.9% post-earnings move with follow-through buying says it all.
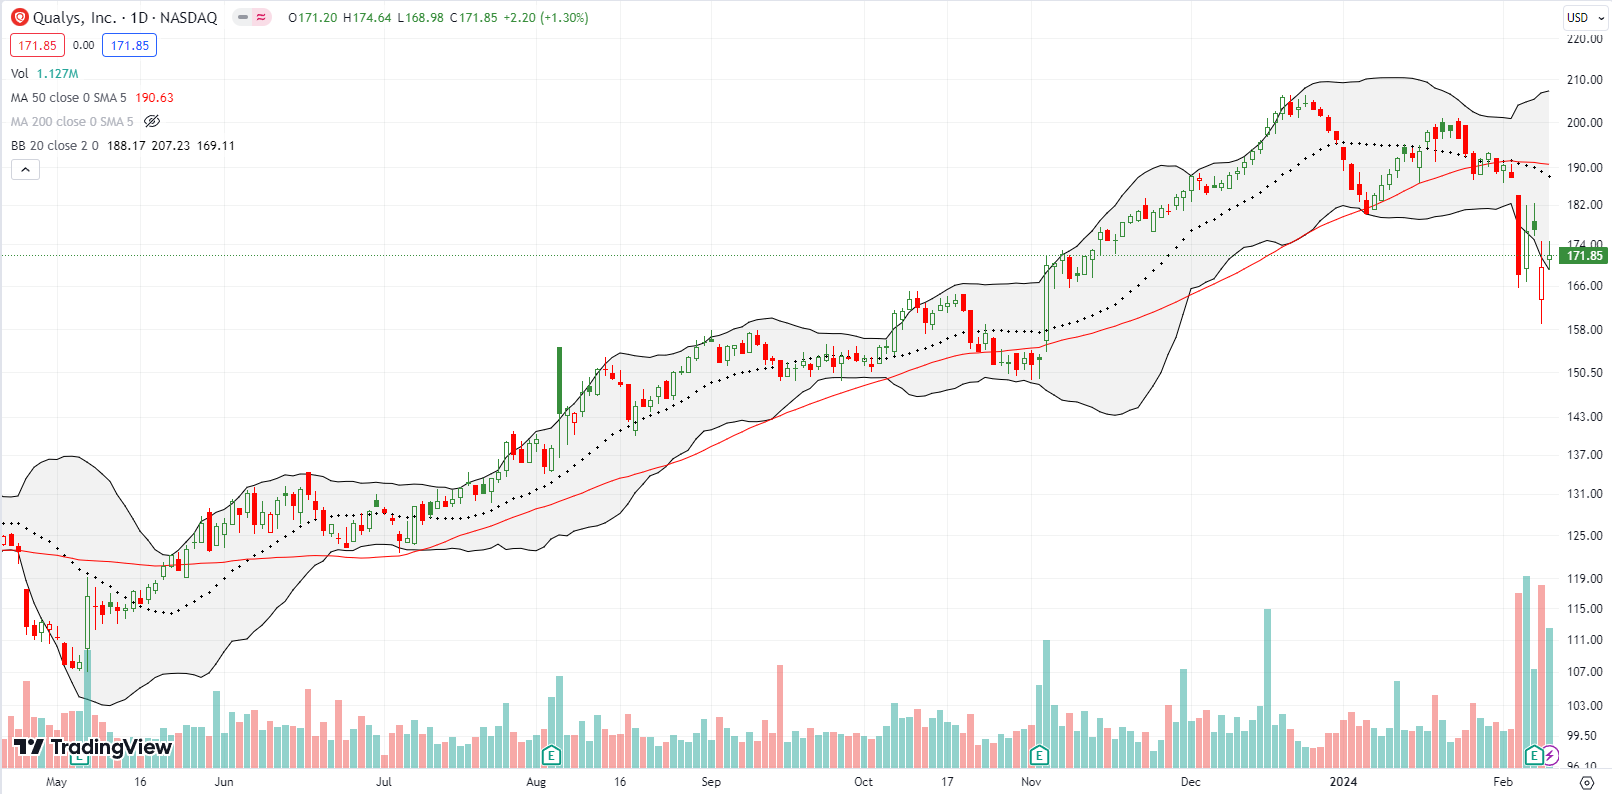
A month ago when I was neutral on the stock market, Qualys, Inc (QLYS) looked like it barely escaped a bearish 50DMA breakdown (below the red line). I looked like a genius buyer for about a week. Since I bought shares with a long-term bias, I proceeded to discount the reemergence of bearish warnings with the stock’s fresh closes below 50DMA support combined with failures at 20DMA resistance (the dotted line). After 6 trading days of precarious living, QLYS plunged 10.5% following a slam from Morgan Stanley (MS) with negative commentary. Since I never sell in a panic, I held my shares. Earnings brought a new gap down. However, instead of selling, I BOUGHT more shares after reading the company’s plan to repurchase shares. Now I am wide awake watching to see whether QLYS will hold its post-earnings intraday low as support.
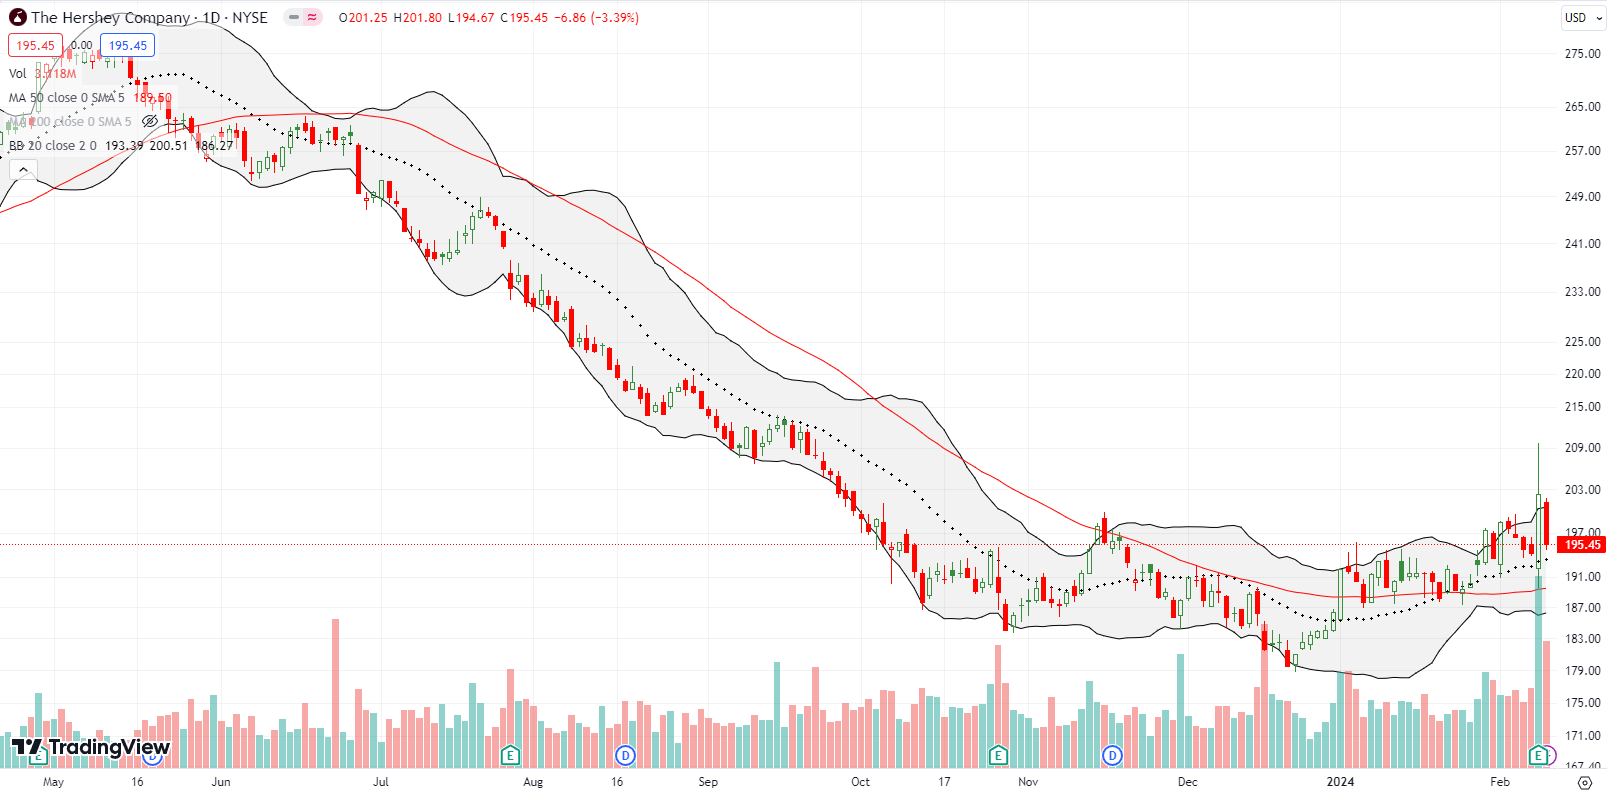
Toward the end of January, I bought long-term shares in The Hershey Company (HSY). I felt like a genius on Thursday when HSY jumped 4.1% post-earnings. Sellers immediately cut me back down to earth by nearly reversing all those gains the next day. HSY still looks like it is bottoming, but the path looks a little more precarious now.
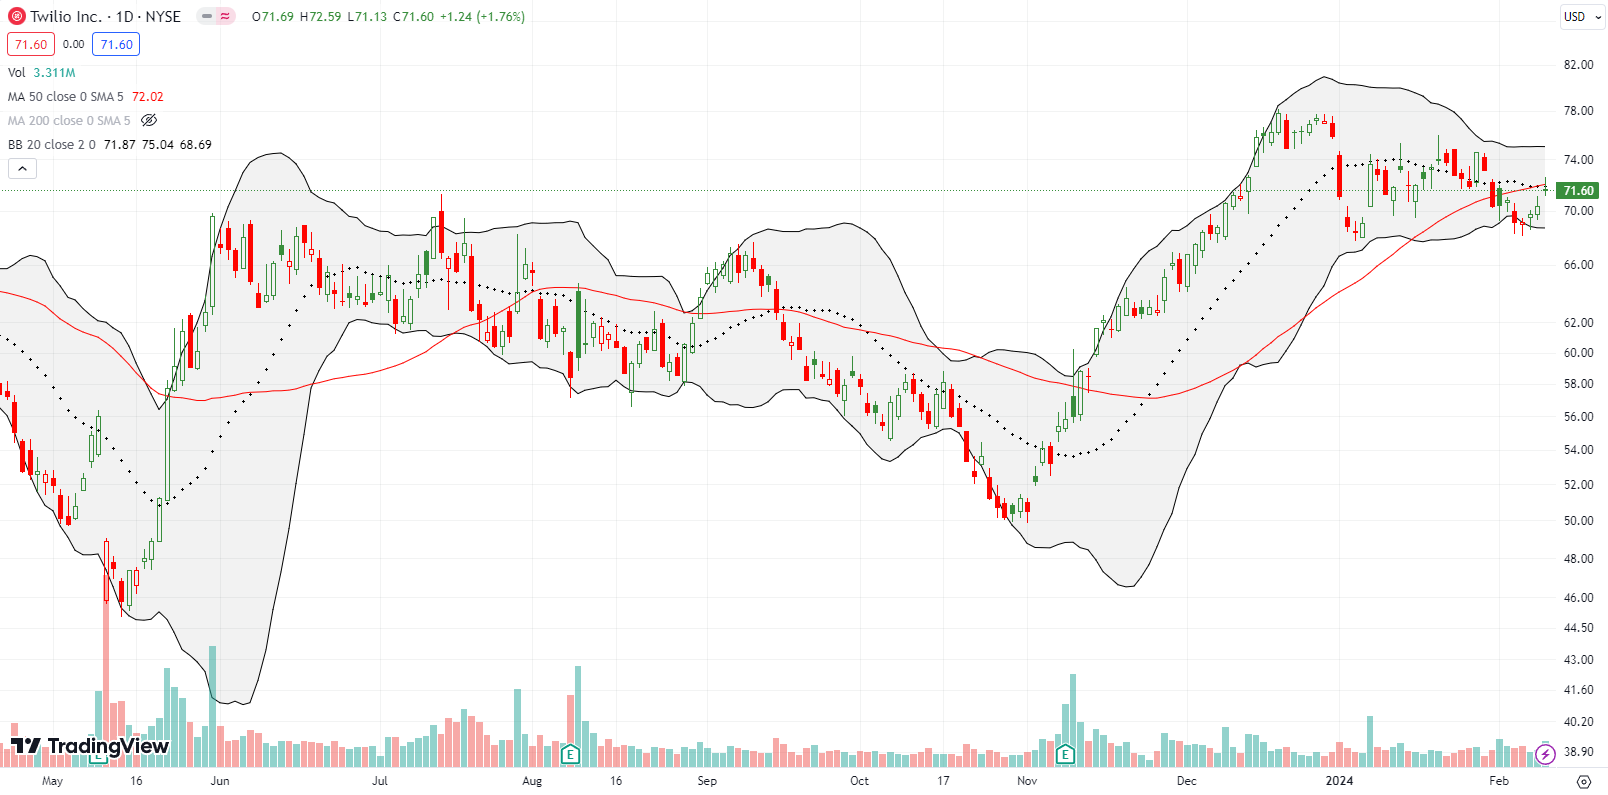
Twilio Inc (TWLO) enjoyed a 6.7% surge on January 8th after announcing a CEO transition and higher guidance for Q4 earnings. The stock mostly churned from there and even finished reversing those gains with last week’s confirmed 50DMA breakdown. The stock’s failure to mount follow-through buying looks very suspicious. I give it a 50/50 chance that the company disappoints investors with guidance for the 2024 year. TWLO did not even receive fresh momentum from a surprising story about a Dutch start-up looking to make a bid for Twilio. The stock closed the week challenging 50DMA resistance.
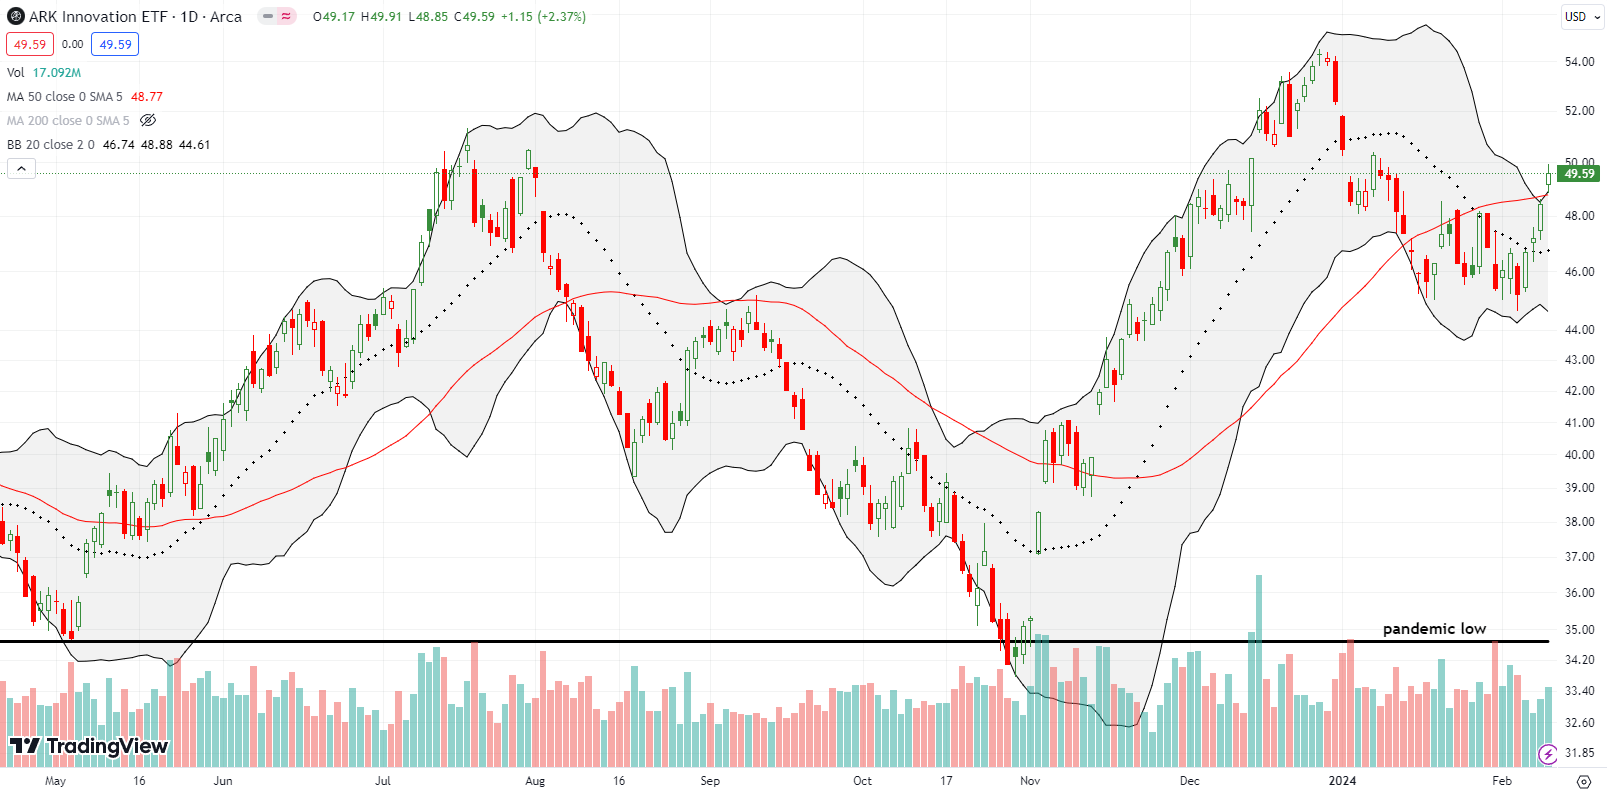
There is perhaps no better sign that the bullish truths are extending invites than Friday’s 50DMA breakout for ARK Innovation ETF (ARKK). This bastion of speculation is deeply underperforming this year and has a LOT of catch-up to do. This 50DMA breakout may be the start of a comeback. I am likely to lose half my position this coming Friday to a covered call. I am staying patient before selling a call against the other half of my “hedge” against bearishness. Needless to say, seeing the ARK funds turn the corner has me bracing for concessions on my bearish bias against the stock market.
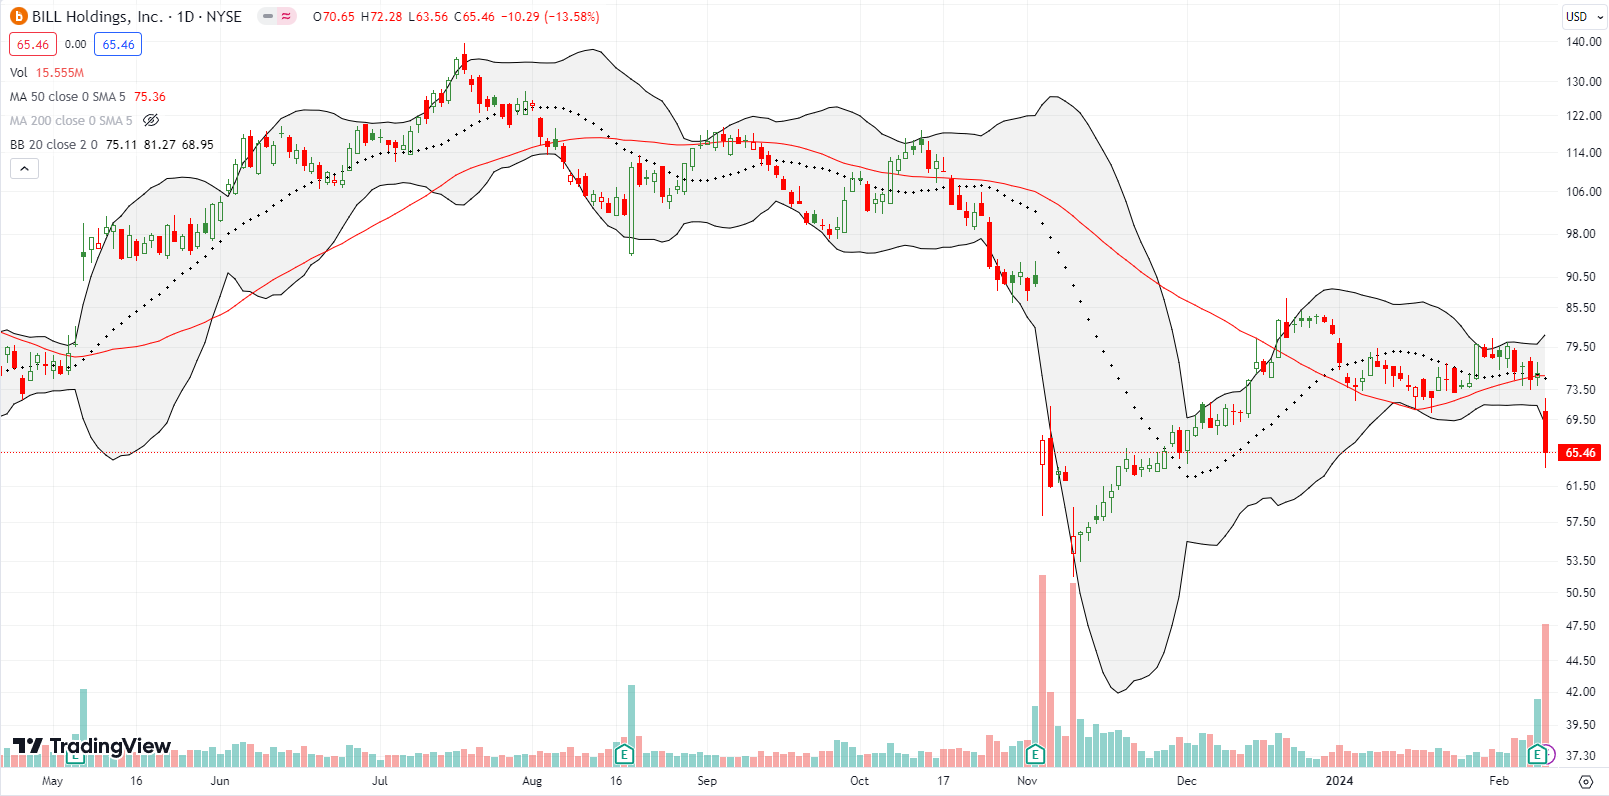
BILL Holdings, Inc (BILL) suffered a 13.6% post-earnings plunge below 50DMA support. This breakdown is about as bearish as it gets. However, BILL was up over 20% in after hours trading in the wake of earnings and the headline news looked fine despite missing “consensus” expectations. So I decided to lean against the bears on this one and speculate on a bounce at least back to 50DMA resistance with shares and a call option. (Yes, my bearish call on the stock market gets weaker by the day!).
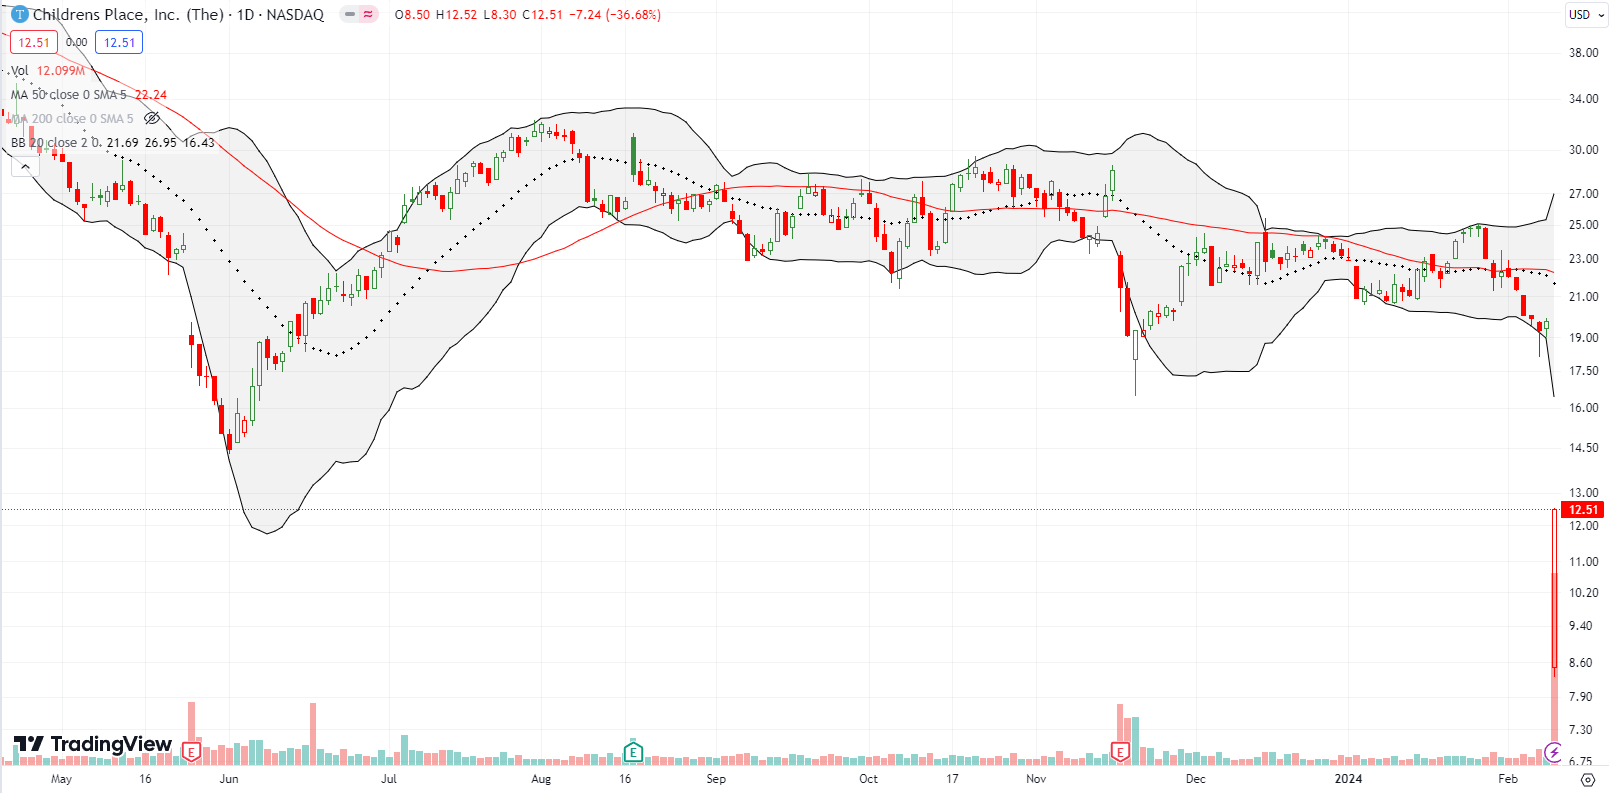
Children’s clothing retailer Children’s Place, Inc (PLCE) had one monster headache of a bearish week. PLCE gapped down 58.0% at the open after reporting earnings. I did not see the carnage until after the stock closed with a 36.7% loss. I know the following claim reads like hindsight, but PLCE looked like a perfect candidate to buy for some kind of rebound from a gut-wrenchingly extreme plunge.
PLCE scared the heck out of investors with talk about a heavy promotion environment. The company guided revenues slightly down but crashed guidance for net operating income. So why buy into this disaster and all-time lows? The company promised to get to a “clean” inventory position by year-end: “the Company projects to end the year in a clean inventory position with inventory expected to be down 16% to 20% versus the prior year.” This is retail-speak for a major reset. At some point, investors will be willing to give this declining company another chance.
Still, buyer beware (emphasis mine): “The Company has been working to improve its liquidity position and strengthen its balance sheet to best position the Company for the future. The Company is working with its advisors (including Centerview Partners), lenders and potential lenders to obtain new financing necessary to support ongoing operations, and is considering strategic alternatives in the event that the Company is unable to consummate new financing.”
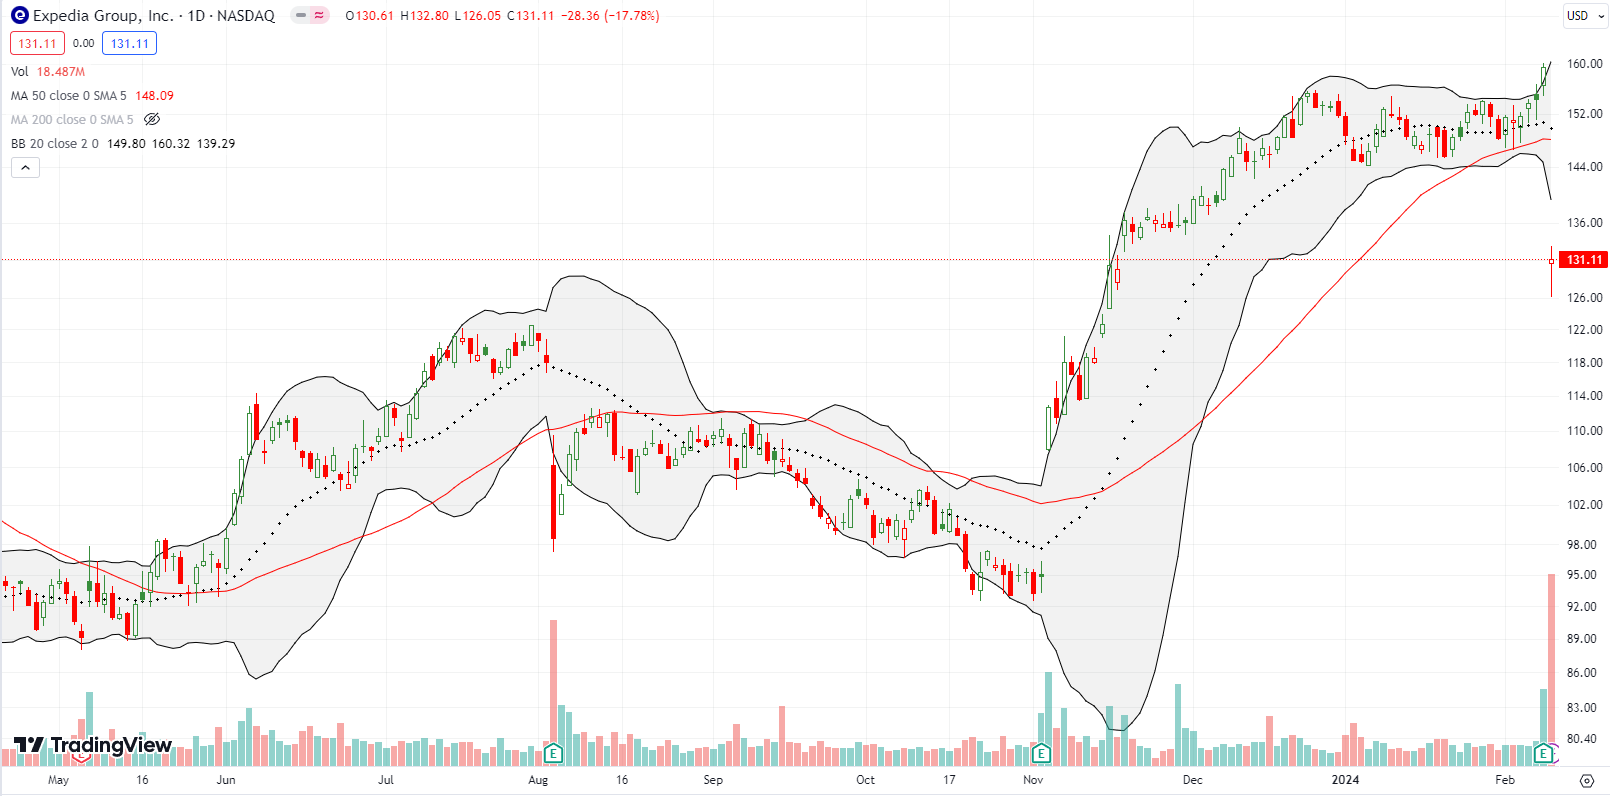
Online travel agent Expedia Group Inc (EXPE) made it to my bearish list. The stock lost 17% post-earnings and left behind a topping pattern complete with a blow-off top. I am watching for a chance to fade a rebound.
Be careful out there!
Footnotes
Subscribe for free to get email notifications of future posts!
“Above the 50” (AT50) uses the percentage of stocks trading above their respective 50-day moving averages (DMAs) to measure breadth in the stock market. Breadth defines the distribution of participation in a rally or sell-off. As a result, AT50 identifies extremes in market sentiment that are likely to reverse. Above the 50 is my alternative name for “MMFI” which is a symbol TradingView.com and other chart vendors use for this breadth indicator. Learn more about AT50 on my Market Breadth Resource Page. AT200, or MMTH, measures the percentage of stocks trading above their respective 200DMAs.
Active AT50 (MMFI) periods: Day #52 over 20%, Day #50 over 30%, Day #48 over 40%, Day #2 over 50% (overperiod), Day #8 under 60% (underperiod), Day #6 under 70%
Source for charts unless otherwise noted: TradingView.com
Full disclosure: long ARKK, long IWM put, long HSY, long QLYS, long BILL shares and call option
FOLLOW Dr. Duru’s commentary on financial markets via StockTwits, Twitter, and even Instagram!
*Charting notes: Stock prices are not adjusted for dividends. Candlestick charts use hollow bodies: open candles indicate a close higher than the open, filled candles indicate an open higher than the close.


