Stock Market Commentary:
The week’s CPI shocker abruptly dissuaded the market from expecting good tidings from the upcoming meeting of the Federal Reserve. Selling followed through two out of the next three days as a nervous breakdown unfolded in the stock market. The S&P 500 (SPY) and the NASDAQ (COMPQ) even printed fresh 2-month closes to end the week. All the selling confirmed overhead resistance at 50-day moving averages (DMAs) and wiped out the brief rally from earlier in the month. Market breadth now hovers above oversold conditions. The sentiment and technical combinations provide an explosive potential for the reaction to the Fed’s updated proclamations on monetary policy.
The Stock Market Indices
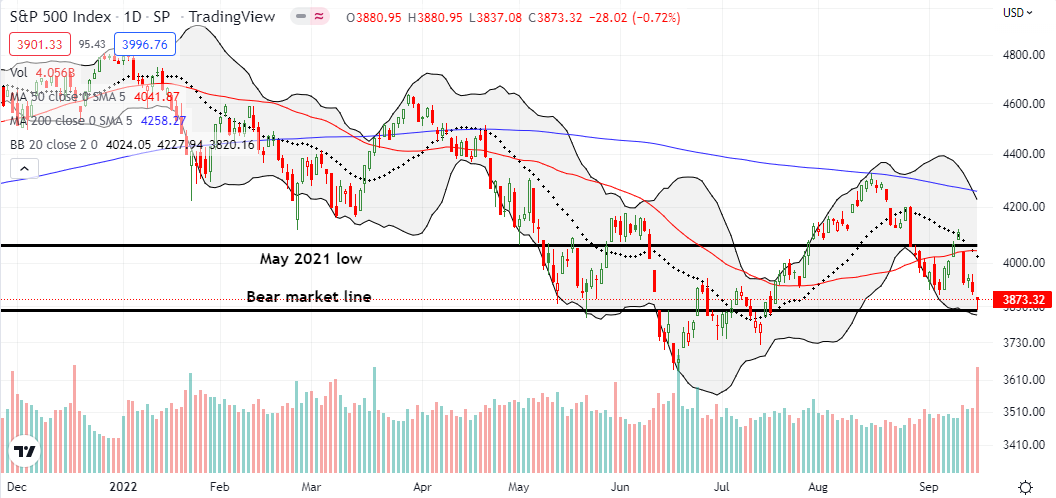
I was wondering why anyone would buy the market into the close given the angst and nervous breakdown of the week. The chart of the S&P 500 (SPY) answered my question. The technicians and related trading bots must have had the bear market line in their sights. The low of the day perfectly tapped that line of support. If not for this poetic display of trading action, I would have concluded that the nervous breakdown for the S&P 500 created a clean breakdown. Instead, there is a sliver of hope buyers may decide to defend this support…just a sliver. With the Fed ahead, my trading strategy was to open call spread and put spreads in anticipation of a big move up or down.
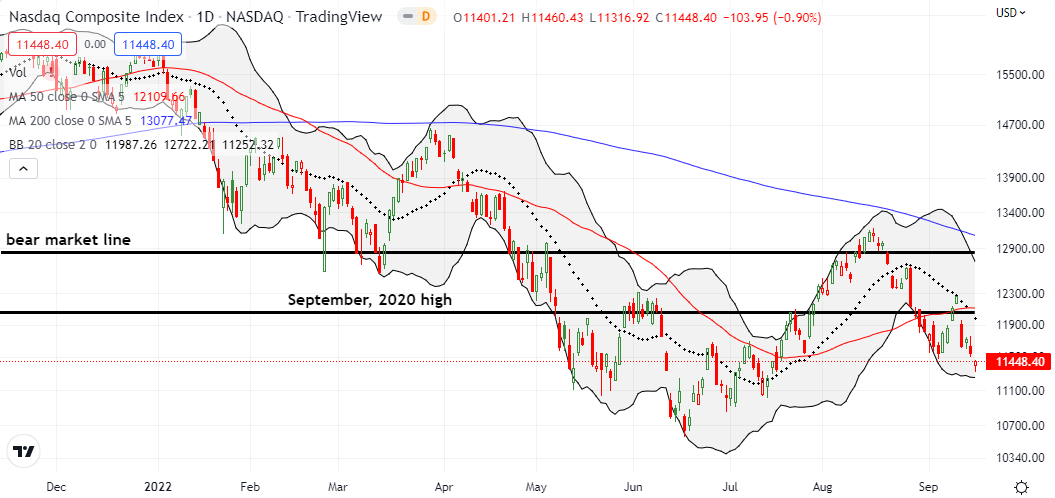
The NASDAQ (COMPQ) likely benefited from the S&P 500’s natural line of support. The tech laden index bounced off its intraday low to minimize the day’s loss to 0.9%. Still, the NASDAQ lost 5.5% for the week and hit a 2-month low as part of its nervous breakdown ahead of the Fed. I opened new bearish trades on QQQ covering the next two weeks and October expiration. I assume I can pivot in time, if needed, to make a play for a retest of resistance at the 50DMA (the red line below). Otherwise, I see large downside potential for the NASDAQ to the June lows and beyond.
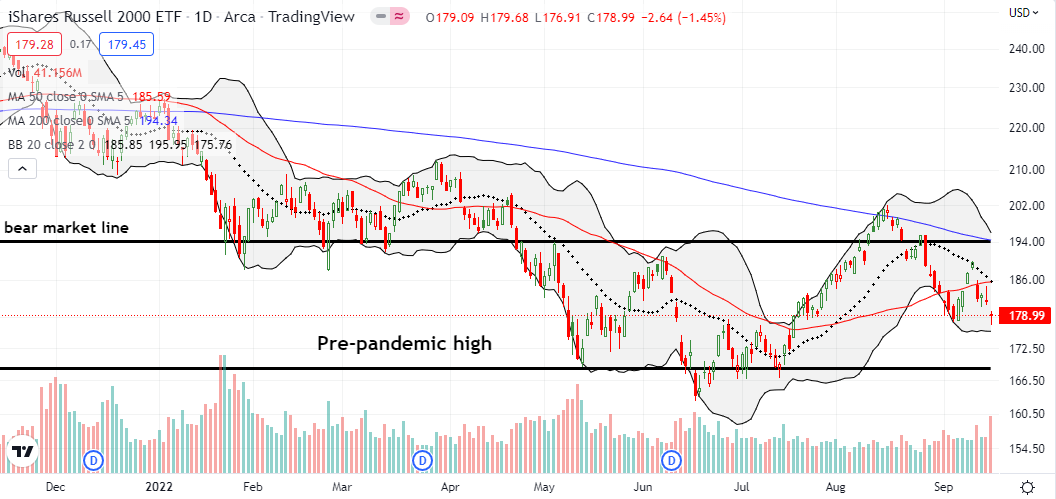
The iShares Russell 2000 ETF (IWM) somehow managed to hold on to its September low as support thanks to the bounce off the intraday low. The ETF of small caps lost 1.5% on the day. I do not see any good risk/reward trades on IWM at this juncture.
Stock Market Volatility
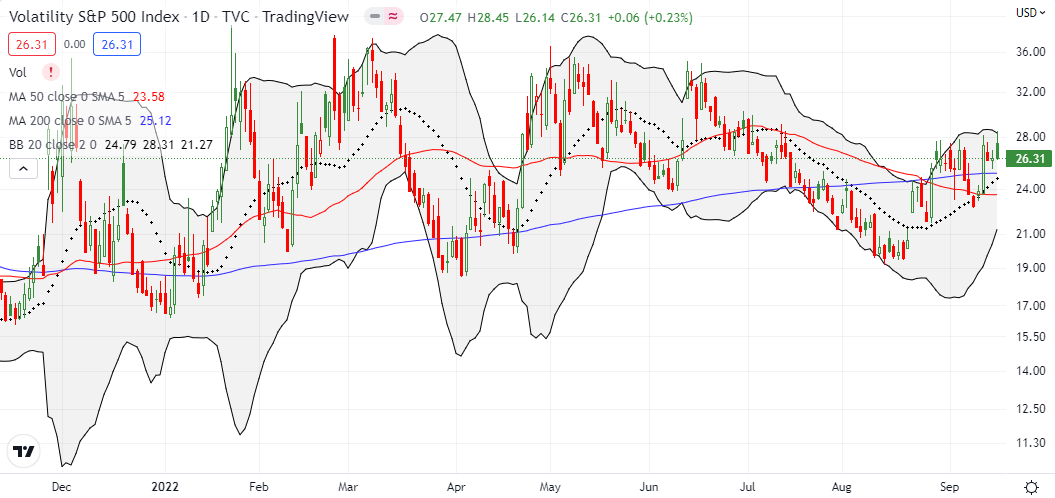
The volatility index (VIX) is certainly losing its value in this latest phase of trading. Despite the market’s nervous breakdown, the VIX managed to close just flat on the day. As long as the VIX keeps churning in the current range in place since the August breakout, I cannot use it as signal or indicator of anything useful.
The Short-Term Trading Call With A Nervous Breakdown
- AT50 (MMFI) = 31.5% of stocks are trading above their respective 50-day moving averages
- AT200 (MMTH) = 26.9% of stocks are trading above their respective 200-day moving averages
- Short-term Trading Call: neutral
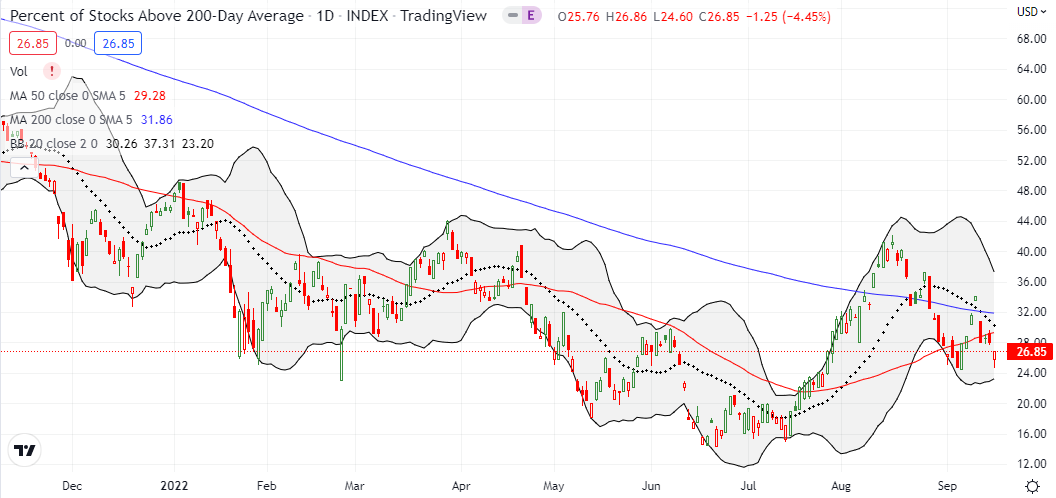
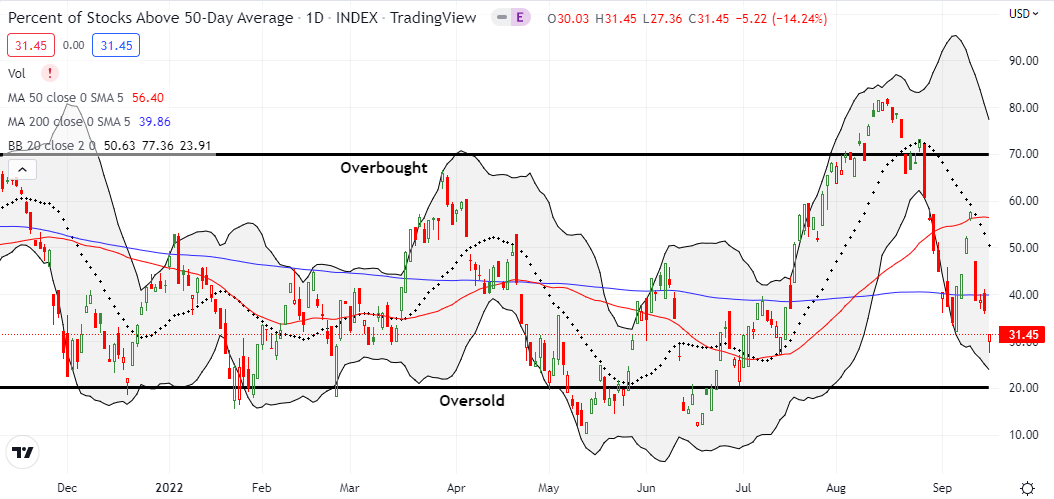
AT50 (MMFI), the percentage of stocks trading above their respective 50DMAs, gapped down and closed at 31.5%, a 2 month low. At its low point, AT50 hit 27.4%. So my favorite technical indicator is right back to “close enough” to oversold territory. However, given the nervous breakdown in the market, I am much less inclined to anticipate a healthy bounce like the abrupt rebound earlier in the month. Moreover, a massive earnings warning from Federal Express (FDX) ignited fresh concerns about the global economy; FDX lost a whopping 21.4% on the news. The short-term trading call will stay at neutral until a true oversold reading (AT50 below 20%) hits the tape.
Once again, we are trapped and bound by the Federal Reserve’s posturing, words, and policy. The Fed holds all the cards for next week with its meeting on Wednesday. In responding to the market’s response, I just have to remind myself that the market’s initial (closing) reaction to the Fed will likely reverse in short order. The constant back and forth in the market from relief and hope to despair and gloom is enough to cause a nervous breakdown for anyone!
Be careful out there!
Footnotes
“Above the 50” (AT50) uses the percentage of stocks trading above their respective 50-day moving averages (DMAs) to measure breadth in the stock market. Breadth defines the distribution of participation in a rally or sell-off. As a result, AT50 identifies extremes in market sentiment that are likely to reverse. Above the 50 is my alternative name for “MMFI” which is a symbol TradingView.com and other chart vendors use for this breadth indicator. Learn more about AT50 on my Market Breadth Resource Page. AT200, or MMTH, measures the percentage of stocks trading above their respective 200DMAs.
Active AT50 (MMFI) periods: Day #53 over 20%, Day #47 over 30% (overperiod), Day #4 under 40% (underperiod), Day #6 under 50%, Day #14 under 60%, Day #15 under 70%
Source for charts unless otherwise noted: TradingView.com
Full disclosure: long QQQ put vertical and calendar spreads, long SPY call, calendar put spread and short put spread
FOLLOW Dr. Duru’s commentary on financial markets via StockTwits, Twitter, and even Instagram!
*Charting notes: Stock prices are not adjusted for dividends. Candlestick charts use hollow bodies: open candles indicate a close higher than the open, filled candles indicate an open higher than the close.


Great analysis in this article.
I reduced half my puts Friday betting on a bounce off support.
Thanks again.
Good luck!
And thanks for reading.
What a lead-in picture! Yikes!
🙂