Housing Market Intro and Summary
Housing starts have remained above pre-pandemic highs while new home sales have spent much of the last year below pre-pandemic highs. In April, new home sales finally dropped back to the early pandemic trough. The South is even at pandemic era lows. The resulting mismatch between starts and sales has created a glut of supply for new homes. Yet, prices remain high as sales shift sharply to higher-end homes. While supplies remain tight for existing homes, soaring prices are finally wearing down demand. First-time (existing) home buyers are retreating from the market after a big rush in January to get ahead of rising rates. The resulting sinking sentiment among home builders portends more deteriorating data to come.
In “Hanging in There“, I contrasted the persistent bullishness of home builders versus the sinking data on the housing market. The data for April strongly suggests that the next round of earnings for home builders will deliver more bad news than good including downward revisions of guidance….at least for those builders who do not have backlogs that will last the entire year and beyond.
Housing Stocks
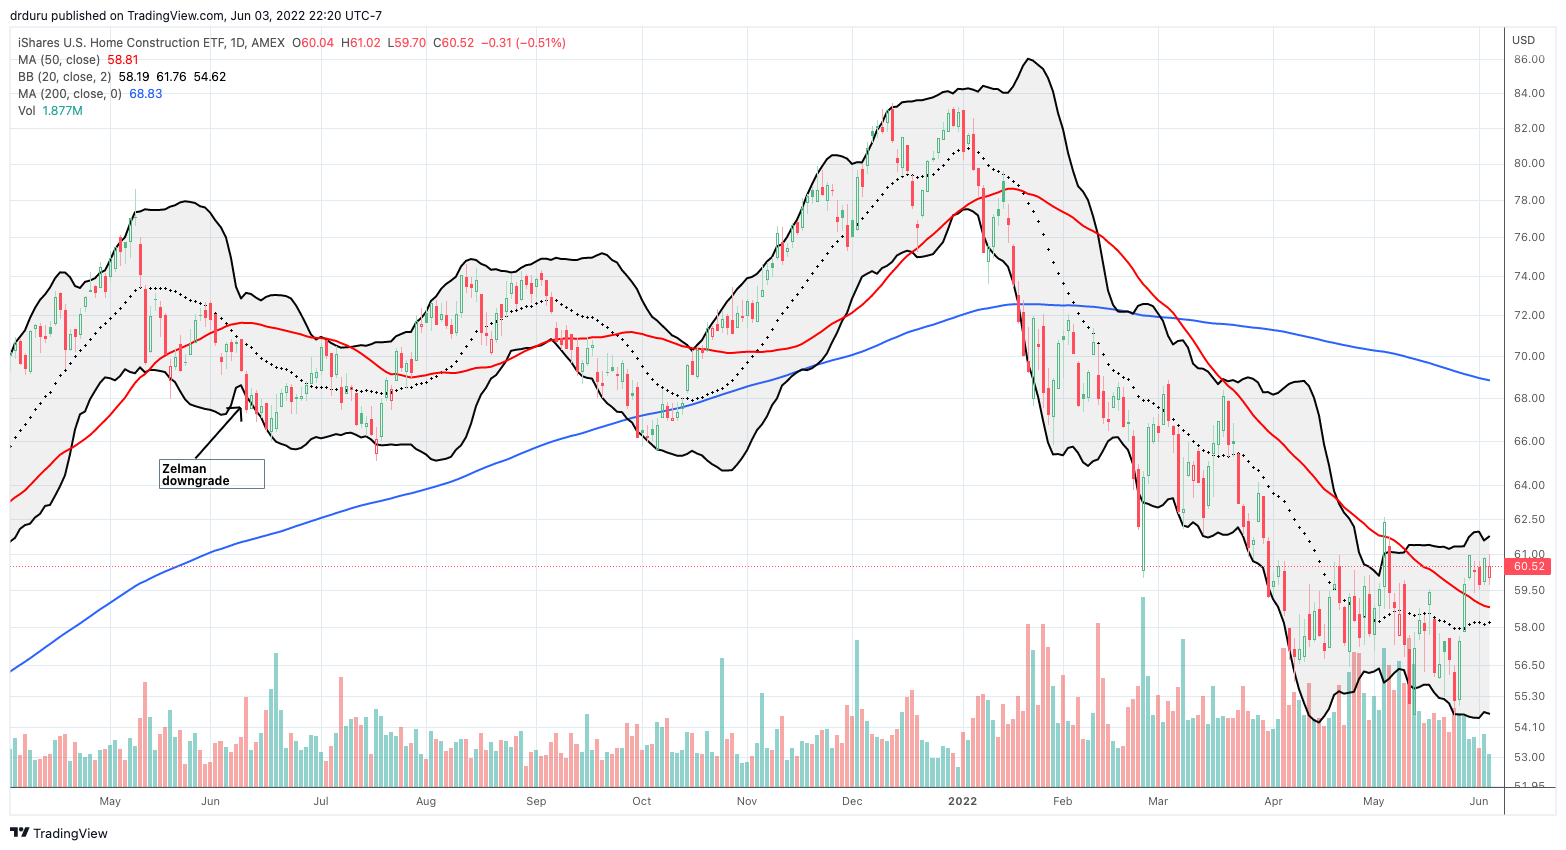
Despite the strong headwinds, the iShares US Home Construction ETF (ITB) managed to gain 4.5% in May and outpaced the flat performance of the S&P 500 (SPY). This is ITB’s second straight month of out-performance. It is very possible the stock market has already priced in a lot of the bad news to come for home builders. The real test will come when home builders start revising guidance downward.

Evidence of the relative out-performance of the high-end of the housing market came from luxury home builder Toll Brothers (TOL). TOL jumped 8.0% after reporting earnings in late May and continued to trade higher. Toll Brothers cited supply chain issues, and not demand, when it lowered delivery guidance. Strong pricing is keeping TOL on target for its revenue guidance. From the Seeking Alpha transcript of the earnings conference call:
“As our industry continues to be challenged by supply chain disruptions, labor shortages and municipal delays, we have revised our full year deliveries guidance. We now expect full year deliveries to be between 11,000 and 11,500 homes, a reduction of about 375 homes at the midpoint. However, we have increased our average delivered price guidance by $15,000 per home to reflect the strong pricing in our backlog. As a result, we expect full year 2022 homebuilding revenues of approximately $10.1 billion at the midpoint of our guidance or 20% growth compared to fiscal year 2021.”
On the other hand, companies dependent on real estate transactions continue to suffer downward pressure. Redfin Corporation (RDFN) lost 12.1% in May and set an all-time low.
Housing Data
New Residential Construction (Single-Family Housing Starts) – April, 2022
In my previous Housing Market Review, I saw a confirmation of a type of plateau in housing starts. April’s sequential drop in housing starts underlines that confirmation.
Starts decreased 7.3% from March to April’s 1,100,000 and edged up 0.7% year-over-year. March’s starts were revised downward to 1,187,000. I am watching to see whether starts stabilize and settle into a range. A breakdown lower would signal a further contraction in expectations for future sales of new homes.
![Housing starts Source: US. Bureau of the Census, Privately Owned Housing Starts: 1-Unit Structures [HOUST1F], first retrieved from FRED, Federal Reserve Bank of St. Louis, April 28, 2022.](https://fred.stlouisfed.org/graph/fredgraph.png?g=PZqR)
The Northeast joined the West for year-over-year gains with a substantial rise. Housing starts in the Northeast, Midwest, South, and West each changed +19.2%, -1.6%, -0.5%, and +0.8% respectively year-over-year.
Existing Home Sales – April, 2022
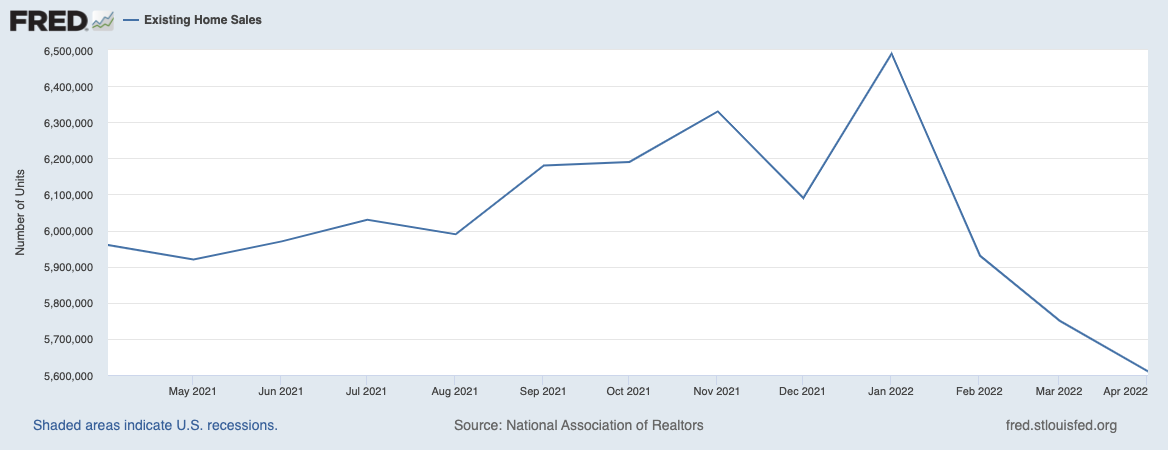
For the second report in a row, the National Association of Realtors (NAR) used “slower demand” to describe the existing homes market. The NAR even predicted more declines ahead: “Higher home prices and sharply higher mortgage rates have reduced buyer activity…It looks like more declines are imminent in the upcoming months, and we’ll likely return to the pre-pandemic home sales activity after the remarkable surge over the past two years.” For reference, pre-pandemic home sales activity was 5.0M to 5.5M in 2019.
Existing home sales dropped for a third month in a row after hitting an all-time high in January. The seasonally adjusted annualized sales in April of 5.61M decreased 2.4% month-over-month from the downwardly revised 5.75M in existing sales for March. Year-over-year sales decreased 5.9%.
Recall that the NAR pointed to the prospects of higher mortgage rates as a driver of demand to explain January’s sales surge. Now, higher rates are likely delivering the double whammy of the impact of demand pull-forward and demand destruction in the go-forward. Suddenly Freddie Mac’s forecast for a mild sales contraction looks very optimistic.
(For historical data from 1999 to 2014, click here. For historical data from 2014 to 2018, click here) Source for chart: National Association of Realtors, Existing Home Sales© [EXHOSLUSM495S], retrieved from FRED, Federal Reserve Bank of St. Louis, May 30, 2022.

April’s absolute inventory level of 950K homes increased 10.8% from March, marking a very rare third straight monthly increase. Still, inventory dropped 10.4% year-over-year (compare to March’s 9.5%, February’s 15.5%, January’s 16.5%, December’s 14.2%, November’s 13.3%, October’s 12.0%, September’s 13.0%, August’s 13.4%, July’s 12.0%, and June’s 18.8% declines, unrevised). “Unsold inventory sits at a 2.2-month supply at the current sales pace, up from 1.9 months in March and down from 2.3 months in April 2021.” The on-going year-over-year decline in inventory is on a 36-month streak.
Once again, the increase in absolute inventories did not impact the time it took for buyers to take a home off the market. The average 17 days it took to sell a home in April was flat with March and flat year-over-year. Market demand among those who can still afford a home remains strong.
The increase in inventory also did not slow down prices. The median price of an existing home jumped 4.4% from March to $391,200, a new all-time high, and soared 14.8% year-over-year. Prices have increased year-over-year for 122 straight months, which is a fresh all-time record streak.
First-time home buyers finally pulled back in share after 2 straight months of share gains. First-time home buyers decreased to a 28% share of sales in April, down from 30% in March and 31% a year ago. The NAR previously speculated that first-timers were scrambling to lock in lower mortgage rates. This drop in share appears to confirm that expectation. The NAR’s 2017 Profile of Home Buyers and Sellers reported an average of 34% for 2017, 33% for 2018, 33% for 2019, 31% for 2020, and 34% for 2021. Interestingly, individual investors or second home buyers did not step into the share gap and even dropped in share from 18% to 17% month-over-month. This share remained flat year-over-year.
All regions declined in sales year-over-year. The regional year-over-year changes were: Northeast -10.7%, Midwest -1.5%, South -5.7%, West -8.1%.
For the seventh month in a row, the South’s median price soared year-over-year. Inflation could continue the price divergence of the South from other regions; the South has outpaced the other three regions 8 months in a row. The regional year-over-year price gains were as follows: Northeast +8.1%, Midwest +8.7%, South +22.2%, West +4.3%.
Single-family home sales decreased 2.5% from March and declined on a yearly basis by 4.8%. The median price of $397,600 was up 14.8% year-over-year.
California Existing Home Sales – April, 2022
The high-end of the market was again the main story for existing home sales in California. Per the California Association of Realtors (C.A.R.):
“The share of million-dollar home sales increased for the third consecutive month, reaching the highest level on record at 34.7 percent. Home sales priced below $500,000, meanwhile, dipped again in April and hit the lowest level ever. Sales dropped by double-digits for price segments $750,000 and below, while sales above $2 million remained on the rise on a year-over-year basis.”
Note March’s share of million-dollar home sales was also an all-time record. The C.A.R. expects this shift in mix to continue alongside an on-going decline in overall existing home sales.
California’s existing homes sales decreased 1.9% month-over-month. For April, the C.A.R. reported 419,040 in existing single-family home sales. Sales decreased 8.5% year-over-year. The sales declines contrast with regionally broad-based price gains. Twenty-six of 51 counties set new median price records, and 33 of 51 counties experienced double digit year-over-year price gains. Overall, April’s $884,890 median price was a 4.2% month-over-month increase and 8.7% year-over-year price hike. The price gain was even large on a per square foot basis. The 13.1% year-over-gain took the average price per square foot from $383 to $433. California’s sales-price-to-list-ratio also increased year-over-year from 103.3% to 104.2%.
The inventory situation improved ever so slightly. A 20% year-over-year gain in property listings was the highest annual growth since January, 2019, but it only “slightly” increased the Unsold Inventory Index (UII) on both a monthly and yearly basis. This follows a March that marked the first time in 2 years where the UII failed to decline year-over-year. The pace of sales also remained fast with the a median duration of days to sell at 8 days versus 7 a year ago.
New Residential Sales (Single-Family) – April, 2022
New home sales of 763,000 were down 8.6% from February’s 835,000 (significantly revised upward from 772,000). Sales were down 12.6% year-over-year. New home sales have moved from tough comparables to below trend performance. The mini-mania in the housing market confirmed its end with the April data.
![new home sales Source: US. Bureau of the Census, New One Family Houses Sold: United States [HSN1F], first retrieved from FRED, Federal Reserve Bank of St. Louis, April 28, 2022.](https://fred.stlouisfed.org/graph/fredgraph.png?g=PZsE)
The median home price hit a fresh all-time high as sales continue to favor higher priced homes. The shift is clearly evident in the widening divergence between the median and average sales prices. The median price increased 3.6% month-over-month to $450,600. The median price also jumped 19.6% year-over-year. The average price soared 9.1% from March to April and hit $570,300. All three of the price tiers starting at $400,000 made significant share gains. Two of the three lowest tiers fell in share. The highest price tier, $750,000 and higher, was the only range that gained in absolute sales month-over-month. In other words, affordability issues are pushing more and more lower-end buyers out of the market while the wealthiest buyers are relatively fine.
![new home median sales price Source: U.S. Census Bureau and U.S. Department of Housing and Urban Development, Median Sales Price for New Houses Sold in the United States [MSPNHSUS], retrieved from FRED, Federal Reserve Bank of St. Louis; April 28, 2022.](https://fred.stlouisfed.org/graph/fredgraph.png?g=Q4Rf)
The monthly inventory of new homes for sale increased a fourth straight month. This time it soared from 6.4 to 9.0. While I expected inventory to continue to increase because of robust housing starts, I did not anticipate such a large one-month shift in inventory. The absolute inventory level resumed its gains going from 407,000 in March to 444,000 in April. The market for new homes is finally in over-supplied territory after years of being either constrained or balanced.
The Northeast was a big winner for the second month in a row with a 17.1% year-over-year gain. Suddenly, the Northeast is the country’s strongest region on a relative basis as new single-family home sales are 16% of their pandemic era peak and well above the lows. The Midwest plunged 25.5%, the seventh straight month with a significant decline. The South hit a large double digit loss for the second month in a row with a drop of 36.6%, making 5 of the last 6 months suffer steep year-over-year declines. Sales in the South are now below the pandemic lockdown trough. This milestone puts the South deep in the middle of a housing slowdown. Note the Midwest hit that point last Fall.
![Regional new one family home sales Source: U.S. Census Bureau and U.S. Department of Housing and Urban Development, New One Family Houses Sold in South Census Region [HSN1FS], Midwest Census Region [HSN1FMW], Northeast Census Region [HSN1FNE], West Census Region [HSN1FW], retrieved from FRED, Federal Reserve Bank of St. Louis, May 1, 2022.](https://fred.stlouisfed.org/graph/fredgraph.png?g=Q4U9)
Home Builder Confidence: The Housing Market Index – May, 2022
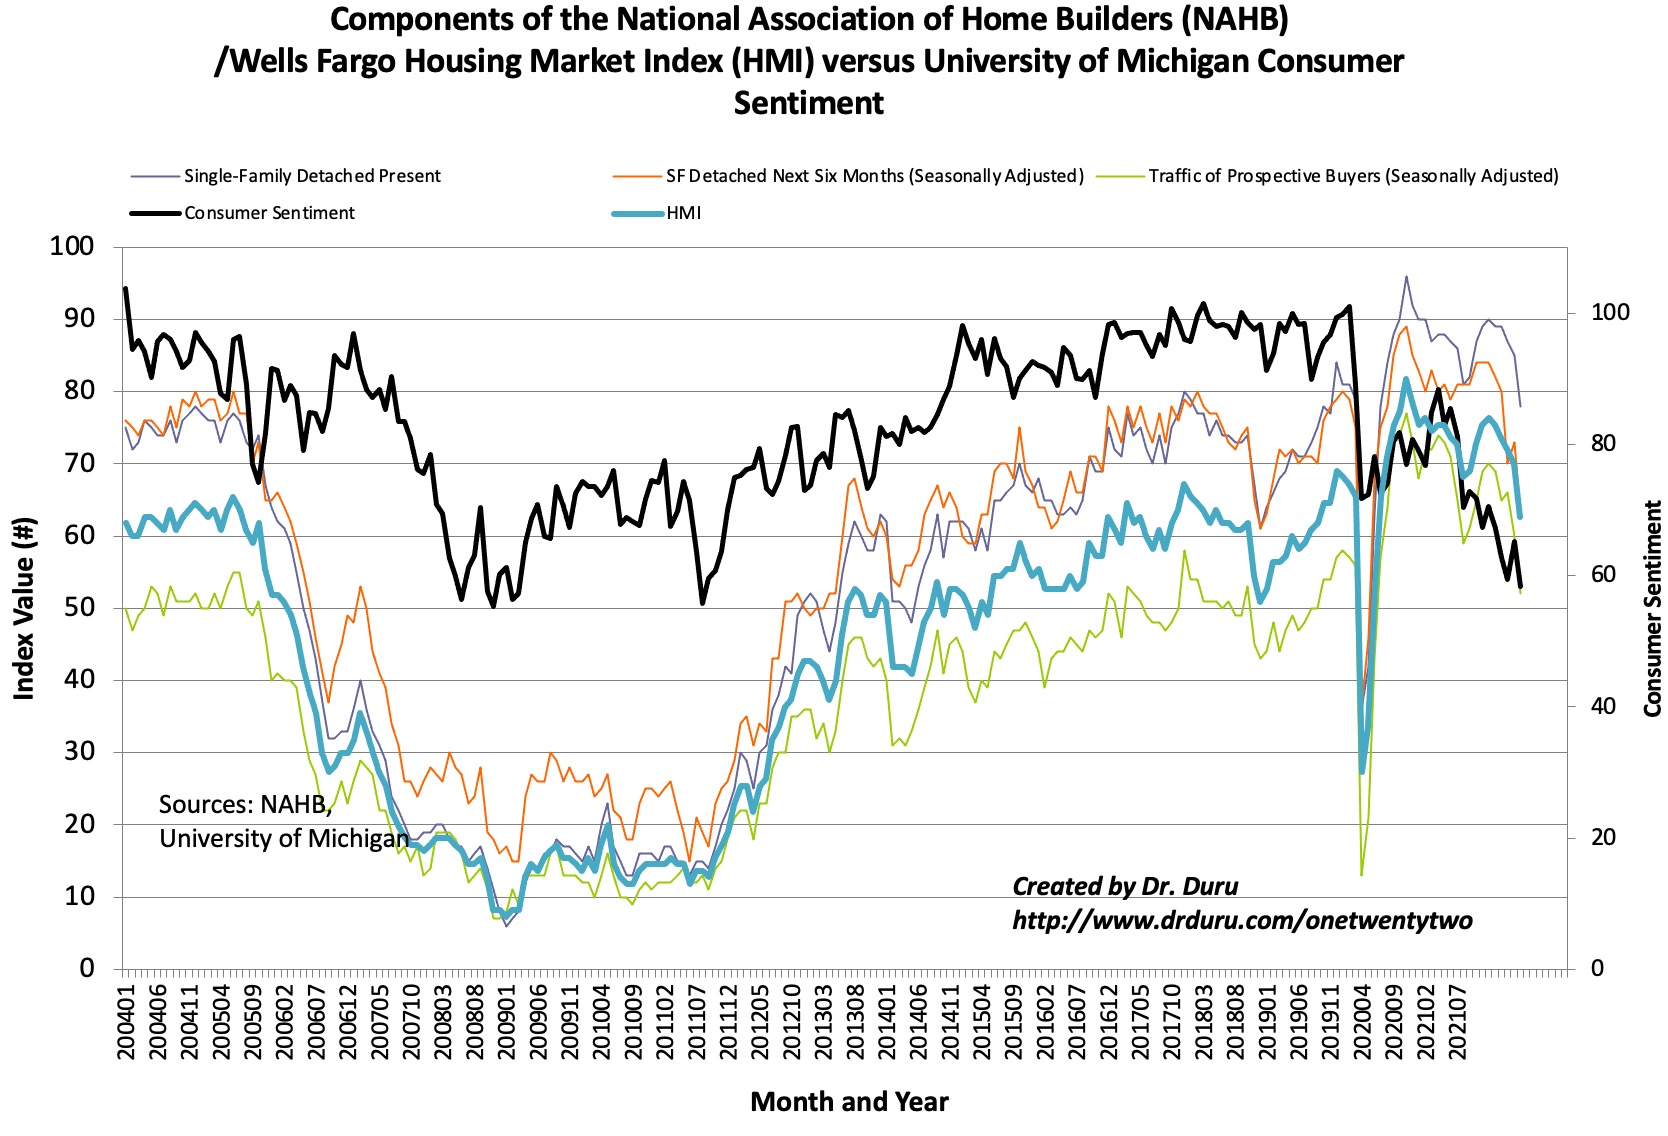
The May report from the National Association of Home Builders (NAHB) on home builder sentiment was so dramatic that I wrote up a dedicated post right after the release: “The NAHB Finally Declares That the Housing Market Is Slowing“. That declaration portended all the poor housing market data that flowed for the rest of the month. The sharp decline in sentiment confirmed the likely depths of the housing slowdown to come.
The declines in sentiment spread across all components of the NAHB/Wells Fargo Housing Market Index (HMI). Consumer Sentiment resumed its decline and hit levels last seen in late 2011.

Source for data: NAHB
The regions were quite divergent for a fifth straight month. Incredibly, the Northeast increased two points to match its high of the year. This improved sentiment aligns with the counter-trend increase in new home sales in the Northeast. The other three regions each suffered sharp declines in sentiment. The Midwest fell a whopping 11 points to 51 and a THREE-year low. The South dropped 6 points to 76 and neared a 2-year low. The West plunged 11 points to 73 and neared a 2-year low.
Home closing thoughts
Institutional Investors
In May, the NAR released a research report studying the impact of institutional buyers on the housing market for both existing homes and rentals. The persistent supply constraint that has driven prices ever higher helps put a spotlight on investors who do not intend to occupy their purchases and instead rent out the property. Theoretically, these rentals take supply off the market and limit the options for buyers. At the same time, rental supply should increase and limit rent levels. But rental prices have soared as well. In studying these market dynamics, I found the following conclusions from the NAR the most interesting and compelling:
- Counties with a higher share of investor purchases had larger drops in available listings. (I am surprised the NAR did not note that we should expect this effect).
- Investors are quite targeted in their purchases as they aim to maximize returns: ” 1) higher household formation; 2) high density of minority groups especially Black households; 3) high density of renters; 3) high density of the Millennial age group; 5) high income and education; 6) many people moving into the area; 7) fast rent growth; 8) fast home appreciation ; 9) fast home sales growth; and 10) lower rental vacancy rate.”
- The share of sales to institutional investors actually peaked in 2014 at 15.7% after trending higher year after year since 2000. Ironically, this peak means that today’s impact from institutional investors is not as important as before. Their activity only stands out more today because of soaring prices and limited inventory.
- To wit, institutional investors seem to have no average impact on pricing: “0% difference in offer price of institutional buyers compared to other buyers on average.”
- On a state basis, institutional buying was heaviest in Texas, Georgia, Oklahoma, Alabama, and Mississippi. These states are all in the South census region which is the housing market’s largest and most significant region.
I saw media that a made a big deal about this report by cherry-picking the best headlines from the findings. The bulk of the report contained descriptive stats about the market. The main surprise was in seeing how institutional investor activity has declined as a share of sales over the last 7 or 8 years.
Spotlight on Mortgage Rates
Given the spotlight on the Federal Reserve’s attempt to normalize policy, I am tracking mortgage rates more regularly. The breathtaking ascent in rates this year finally ran out of gas in late May. While rates are not likely to decline much further from here, they finally look ready to stabilize around the 5% level. Such stabilization will provide one firmer foundation for the housing market.
![Sources include: Board of Governors of the Federal Reserve System (US), Market Yield on U.S. Treasury Securities at 30-Year Constant Maturity [DGS30], retrieved from FRED, Federal Reserve Bank of St. Louis and Freddie Mac, 30-Year Fixed Rate Mortgage Average in the United States [MORTGAGE30US], retrieved from FRED, Federal Reserve Bank of St. Louis, May 1, 2022](https://fred.stlouisfed.org/graph/fredgraph.png?g=Q7uT)
April Pending Home Sales
According to the NAR, pending home sales “represent homes that have a signed contract to purchase on them but have yet to close. They tend to lead existing-home sales data by one to two months.” So the new 2-year low in pending home sales in April suggests more sales declines are on the way for the housing market. Pending home sales hit a peak in October, 2021 and have declined every month since.
Be careful out there!
Full disclosure: long ITB shares, long SPY calendar call spread

