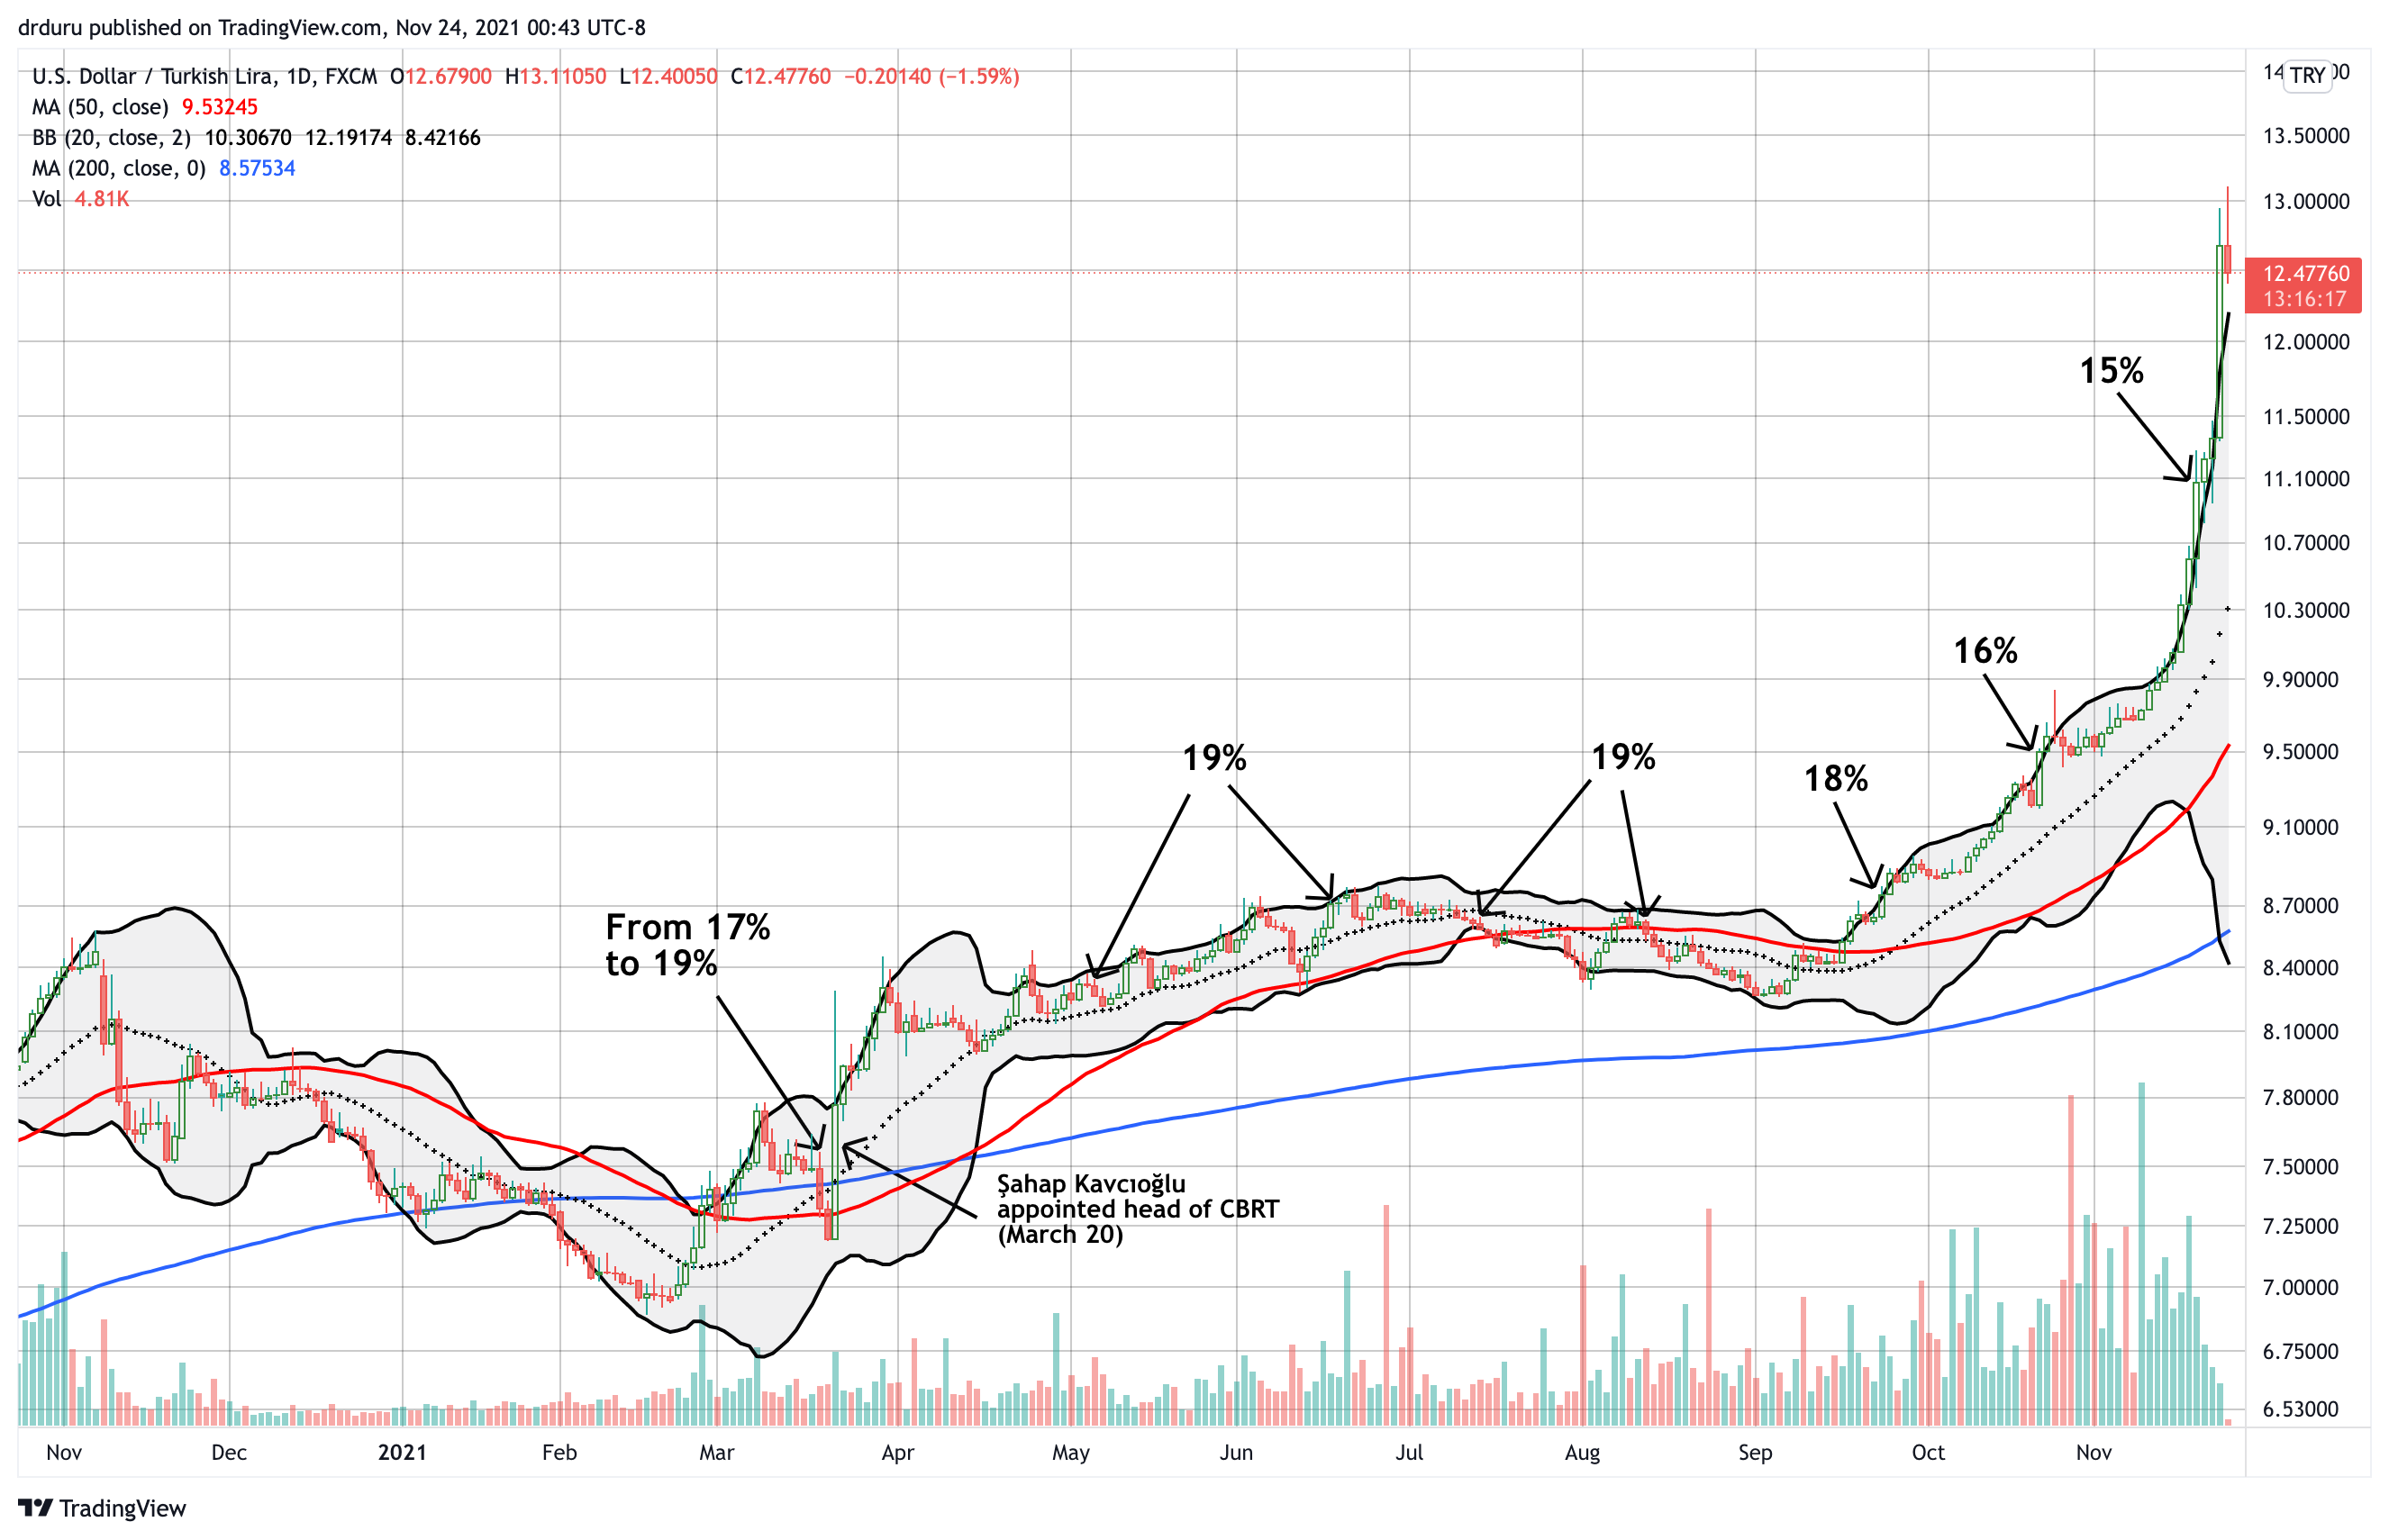
The Turkish lira is in freefall. On November 23rd, the U.S. dollar gained about 12% against the Turkish lira. USD/TRY is up 55% since the end of August and up 74% year-to-date. The current parabolic Turkish lira move culminates an epic battle that Turkey’s President Recep Tayyip Erdoğan is waging against monetary orthodoxy. Erdoğan has long claimed that fighting inflation requires lower interest rates. The President finally decided to prove his point after Naci Ağbal, the former head of the Central Bank of the Republic of Turkey (CBRT), decided to fight inflation with another rate hike. On March 18th, he pushed rates from 17% to 19%. Shortly after that move, Erdoğan fired Ağbal and installed Şahap Kavcıoğlu as the new head of the CBRT.
A nervous currency market immediately sold the Turkish lira. As a result, Kavcıoğlu proceeded to attempt a stabilization of the currency. He waited 6 months before embarking on a plan of rate cuts. USD/TRY was already at an all-time high going into the first rate cut decision in September. The rate cut left the momentum intact. The chart below maps out the parabolic path of destruction for the lira with labels for the level of interest rates at each decision point.

The Trade On A Parabolic Turkish lira
With President Erdoğan digging in his heels for a “war of economic independence”, the implosion of the Turkish lira looks like it will endure for some time to come. However, parabolic moves are inherently unstable. Something has to give. Whether motivated sellers of the lira finally exhaust themselves, lira shorts reach for profits, and/or market forces actually compel the CBRT to align with traditional inflation-fighting policies, a pullback from this parabolic move lies ahead. Indeed, the chart above shows early signs of a cooling of the parabolic move. Accordingly, I tried a first small fade of the parabolic move (stop loss above 13.2).
If a USD/TRY pullback occurs without accompanying policy changes, then technical factors should provide sufficient guides for trading. A consolidation move and/or test of support at the 20-day moving average (DMA) or 50DMA would set the stage for the next round of selling in the Turkish lira. For context, a parabolic Turkish lira lasted for about 6 trading days in August, 2018. USD/TRY took almost two more years to top that all-time high.
Whatever the path forward, the Turkish people are trapped in the wake of this massive monetary experiment. As a result, I expect related political and/or social challenges to feed back into volatility and even more instability for the Turkish lira.
For reference, here are links to the last 8 interest rate decisions:
- March 18: 17% to 19%
- May 6: Left at 19%
- June 17: Left at 19%
- July 14: Left at 19%
- August 12: Left at 19%
- September 23: 19% to 18%
- October 21: 18% to 16%
- November 18: 16% to 15%
Be careful out there!
Full disclosure: short USD/TRY

This is utterly fascinating for its potential repercussions.
Imagine the global impact if the rate-cutting approach *works* !!!
It would be utterly mind-boggling if it works!
And, honestly, if the Turkish lira were the world’s reserve currency…and if Turkey was not already running such a huge current account deficit, perhaps then rate cutting to stoke enough growth to race ahead of inflation could make more sense… at least as a desperate, long shot experiment. The CBRT is truly trapped in a way that the Fed could never imagine.
Note to readers: I took profits on my short USD/TRY as the pair quickly dropped 5% or so after I opened the position. At the time of writing, a new COVID-19 variant scare is pressuring all speculative and emerging market currencies and has changed the balance of trades quick, fast, and in a hurry!
Another update: USD/TRY is currently running back into parabolic mode! It’s tempting to join the shorts on the Turkish lira. However, as I mentioned, parabolic moves are inherently unstable. As a result, I prefer to wait for the next signs of a topping out.