AT40 = 63.0% of stocks are trading above their respective 40-day moving averages (DMAs)
AT200 = 41.8% of stocks are trading above their respective 200DMAs
VIX = 14.3 (10.7% drop)
Short-term Trading Call: bearish
Stock Market Commentary
The stock market’s scramble for support worked bigtime today.
In my last Above the 40 post, I described the dilemma facing my flip from cautiously bearish to bearish for my short-term trading call. The stock market wasted no time in forcing me to stay my hand right in the middle of the rule I established to guide bearish trades: wait for a breakdown or a test of key resistance. Bears like me were clearly put on notice with today’s trading action. It looks like my next bearish trade will be at a test of resistance. If THAT resistance gives way, then I will be forced to flip neutral and watch the stock market go right back into an extended overbought trading spree.
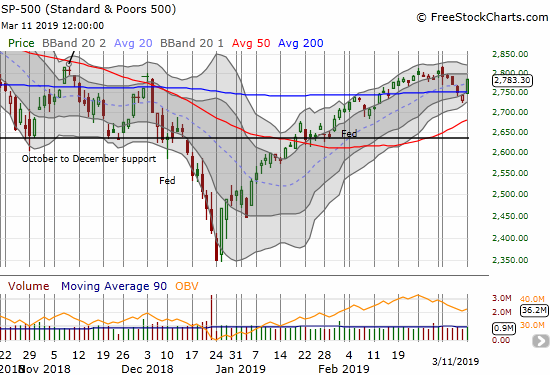
The S&P 500 (SPY) soared 1.5% as it leaped over its 200-day moving average (DMA) in picture-perfect form.
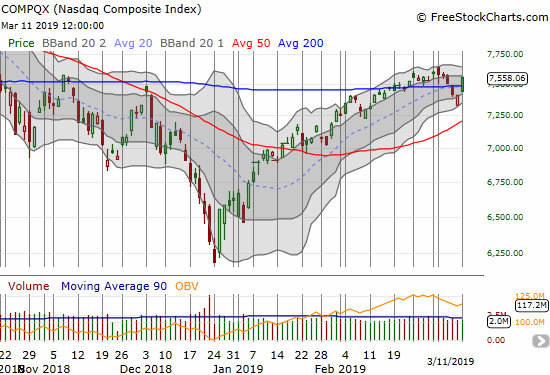
The NASDAQ (NDX) did the S&P 500 one better by gapping up and through its 200DMA and closing with a 2.0% gain. The tech-laden index tapped the lower bound of its upper Bollinger Band (BB).
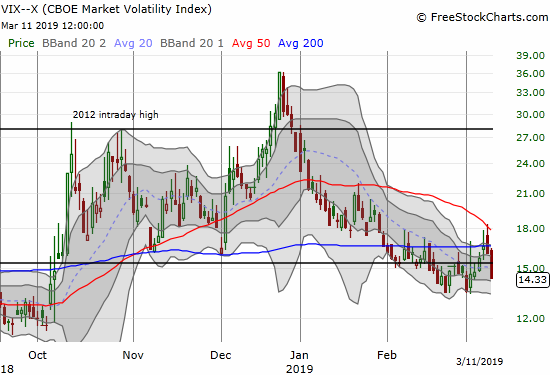
The volatility index, the VIX, underlined the rush back into the market with a 10.7% plunge well below the 15.35 pivot. The move was a perfect continuation of Friday’s fade. My only new bearish trade on the day was to triple down on my Pro Shares Ultra VIX Short-Term Futures ETF (UVXY) call option (needless to say I cycled through some other call options which are accompanying short shares!). These UVXY calls expire on Friday, so they are even more speculative than usual.
AT40 (T2108), the percentage of stocks trading above their respective 40-day moving averages (DMAs), confirmed the rush back to “risk-on” trading by leaping from 54.1% to 63.0%. Suddenly, my favorite technical indicator is within sniffing distance of overbought levels (above 70%) all over again. In my last post, I noted how AT40’s rapid drop the previous 3-5 days generated a condition that “felt” oversold. I never even thought about trying to trade that “quasi-oversold” condition from the long side. If I had, I would have taken profits as quickly as I took last week’s profits from new bearish trades.
Now, as bears sit up straight and take notice, I will be watching to see how the S&P 500 (SPY) challenges its 2019 high, a high that was set on the first day of the month.
Stock Chart Reviews
Apple (AAPL)
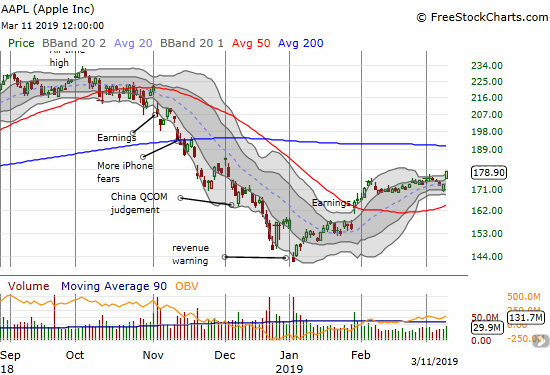
My bearishness restricted my weekly play on Apple (AAPL) call options to a single call. My very optimistic profit target of a double was exceeded with a close with a triple….and AAPL was just getting started. The stock made a definitive statement with a close on its high of the day and a new 3-month high. As I like to say, it is hard to stay bearish when AAPL is in rally mode. So, AAPL has put me on notice that the S&P 500 is likely to soon, and easily, challenge its 2019 high!
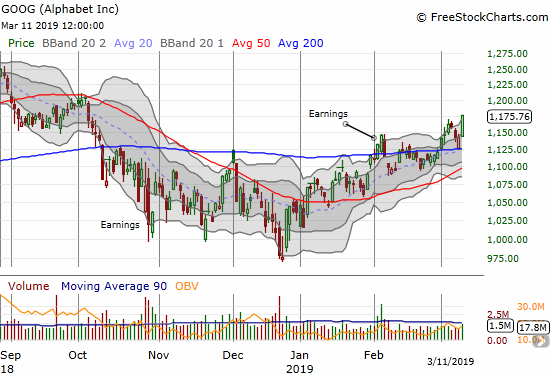
Alphabet (GOOG)
Alphabet (GOOG) gained less than AAPL did, but the stock looks more impressive. GOOG broke out to a 5-month high and confirmed 200DMA support. The stock looks like it built a strong base from the wide consolidation underneath the 200DMA. GOOG is a buy-the-dip stock now, so it will NOT be on my list of stocks to short unless it drops below its 200DMA again.
— – —
FOLLOW Dr. Duru’s commentary on financial markets via email, StockTwits, Twitter, and even Instagram!
“Above the 40” uses the percentage of stocks trading above their respective 40-day moving averages (DMAs) to assess the technical health of the stock market and to identify extremes in market sentiment that are likely to reverse. Abbreviated as AT40, Above the 40 is an alternative label for “T2108” which was created by Worden. Learn more about T2108 on my T2108 Resource Page. AT200, or T2107, measures the percentage of stocks trading above their respective 200DMAs.
Active AT40 (T2108) periods: Day #45 over 20%, Day #43 over 30%, Day #42 over 40%, Day #41 over 50%, Day #1 over 60% (overperiod ending 2 days under 60%), Day #4 under 70% (underperiod)
Daily AT40 (T2108)

Black line: AT40 (T2108) (% measured on the right)
Red line: Overbought threshold (70%); Blue line: Oversold threshold (20%)
Weekly AT40 (T2108)

*All charts created using freestockcharts.com unless otherwise stated
The T2108 charts above are my LATEST updates independent of the date of this given AT40 post. For my latest AT40 post click here.
Related links:
The AT40 (T2108) Resource Page
You can follow real-time T2108 commentary on twitter using the #T2108 or #AT40 hashtags. T2108-related trades and other trades are occasionally posted on twitter using the #120trade hashtag.
Be careful out there!
Full disclosure: long UVXY calls
*Charting notes: FreeStockCharts.com stock prices are not adjusted for dividends. TradingView.com charts for currencies use Tokyo time as the start of the forex trading day. FreeStockCharts.com currency charts are based on Eastern U.S. time to define the trading day.
