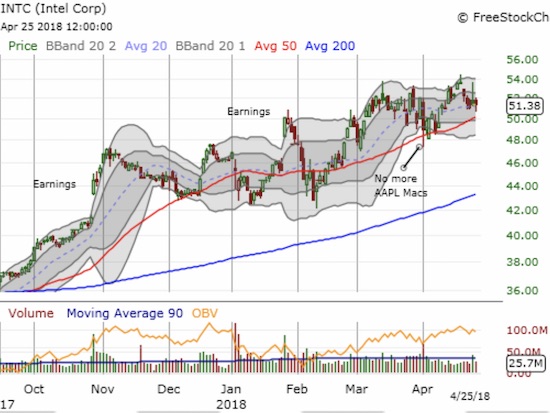
Over the last two earnings reports, Intel (INTC) experienced historic 1-day gains. For January earnings that reported on Q4 results, INTC enjoyed a 10.7% gain the next day. For October earnings that reported on Q3 results, INTC enjoyed a 7.4% pop. These 1-day post-earnings gains were Intel’s 3rd and 7th highest 1-day post-earnings gains since at least 1997 (available data). The last time INTC popped higher than these last two cycles was a 9.3% 1-day post-earnings gain in July, 2014 that reported on Q2 results.
The Q3-driven gain was INTC’s highest Q3 since at least 1997. The Q4-driven gain was INTC’s highest Q4 dating all the way back to January, 2000, when a 13.2% 1-day gain heralded the peak in tech just ahead of the collapse.
Another way to put INTC’s recent post-earnings strength in context is to compare the average magnitudes of post-earnings moves, meaning the absolute values. So, -3% is treated like 3% in calculating an average. Since 1997, the average post-earnings gain in magnitude by the earnings quarter is as follows:
- 3.9%
- 4.5%
- 4.0%
- 4.8%
The average post-earnings gain in magnitude over all quarters since 2010 is 3.4%. Over all quarters since 1997 the average is 4.3%.
In other words, INTC has strung together two incredible post-earnings performances the last two times around.
Despite this strength, INTC came close to reversing the Oct post-earnings gains twice: once in January and again in February. Both of these occasions proved to be perfect opportunities for me to make my typical post-earnings trades in call options. The late January, early February sell-off erased the January pop within 6 trading days. Now trading at $51.38, INTC has recovered nicely from the earlier sell-off but it is only 2.6% higher than the close of the first day of post-earnings trading in January.

Source: FreeStockCharts.com
I throw up all these numbers as context for the options pricing for INTC going into earnings after the market closes on April 26, 2018 (Q1 earnings). At the time of writing, the at-the-money straddle ($51.50 strike) expiring this Friday costs $244 (excluding commissions). This pricing implies a 4.7% move in INTC stock. Such a move represents the breakeven point for this straddle, and it represents the simplified method for estimating the market’s expectations for a stock move at expiration. This expectation is in-line with the entirety of the historic record but is above the Q1 historical record. I also cannot help but think the last two earnings results have caused a slight inflation in the implied volatility this time around.
With this context, I decided to resist the temptation of trying a pre-earnings trade on INTC, and I will instead, as usual, wait for a between-earnings dip to make a trade. Not to mention I am still “cautiously bearish” on the stock market!
Be careful out there!
Full disclosure: no positions
Click here to download data used in this analysis. Earnings dates from briefing.com. Stock price data available on Yahoo Finance.
