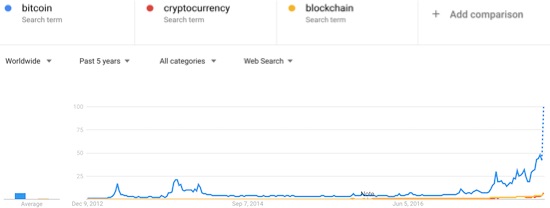
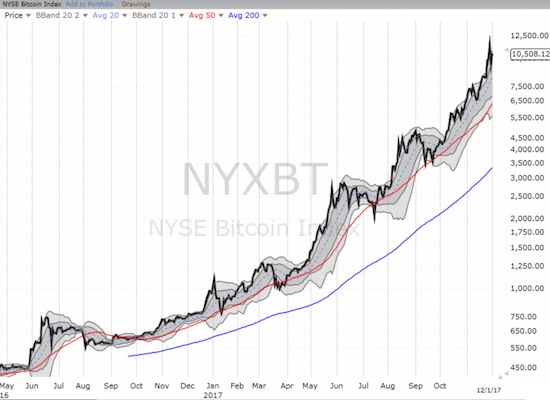
I am a fan of using Google Trends for understanding the dynamics of financial markets. I have specifically used it in the past for analyzing extremes in sentiment and trading on gold. Given Bitcoin’s latest historical surge – this time through $11,000 – I wondered whether Google (GOOG) searches were increasing alongside the price of Bitcoin. Sure enough, Bitcoin searches have taken off this year, especially since April. I added search index data on cryptocurrency and blockchain for reference. The data are worldwide and include all search categories.

Source: Google Trends
The dotted line indicates that the data for the week is incomplete. The last day in the record is Wednesday, November 29th. Bitcoin traded through $11,000 on that day.
I did a quick and dirty check on correlations to check the historical relationship (recall that correlations range from -1 to 1 where -1 means the two data series move proportionally in exactly opposite directions and a 1 means the two data series move proportionally in exactly the same direction). Since searches and prices are generally trending higher, I would expect a high correlation (roughly above 0.5). However, I was still a bit surprised at these numbers:
Since December 9, 2012…
Weekly correlation: 0.91
Year-to-date…
Weekly correlation: 0.90
Daily correlation: 0.82
Daily percentage change correlation: -0.01
Daily percentage change correlation – search index lag Bitcoin by 1 day: 0.05
The last two correlations relate the daily percentage change in the price of Bitcoin to the daily percentage change in the Google search index for Bitcoin. The two are completely uncorrelated even after lagging the search index one day behind the change in the price of Bitcoin. Taken all together, these data confirm that the price of Bitcoin and searches on Bitcoin trend together: Google search trends confirm the current Bitcoin run-up. However, if any specific and reliably predictive relationship exists, a more complex model will have to find it. If these data represented gold prices and searches, I would assume that gold is currently hitting a (temporary) peak. The surging searches confirm an unsustainable frenzy and interest in the asset run-up.
A great example of the cautions on correlations occurs right at the end of the data series. The search index surged from 60 to 100 from November 28th to the 29th. On November 29th, the price of Bitcoin dropped by 1%. The next day, Bitcoin fell fractionally. However, there could be a better relationship to intraday extremes. On November 29th, Bitcoin hit a high of $11,418, a 15% increase from the previous day’s close. On November 30th, Bitcoin hit a high of $10,689, a 9% increase from the previous day’s close.
Similarly, perhaps I need to look at hourly search index data. For example, the peak search activity over the past 7 days occurred right at 11am Eastern on November 29th. According to Yahoo Finance, Bitcoin peaked that day around 8am Eastern.
A counter-example occurred on September 13, 2017 when Bitcoin cratered 16%. Google searches soared that day by 38%. If I saw this with gold, I would assume that gold was reaching a bottom (depending on other technical factors). It seems buyers are the most active searchers. So when an asset plummets in price, people may scramble to understand what happened and often find reason to find opportunity in the news. If searches barely budge or even decline, I assume the relative disinterest confirms a more lasting decline is underway. Bitcoin jumped the next day by 15%.
For now, I will leave it to intrepid Bitcoin traders to uncover more complex relationships.

Source: FreeStockCharts.com
In the meantime, you can come here to get updates on Google Searches. Click the source link to configure the inputs to your preference and then bookmark in your browser.
Hourly over the last 7 days
Weekly over the last 5 years
Source: Google Trends
Click here to download a copy the data that I used and analyzed (Excel spreadsheet).
Be VERY careful out there!
Full disclosure: no positions
