
Against the U.S. dollar, the Mexican peso, USD/MXN, has left its 15-month low in the dust. For the past month, USD/MXN has neatly followed its upper-Bollinger Bands (BBs) straight through a bullish confirmation of a 50DMA breakout and then a bullish breakout above its 200-day moving average (DMA).
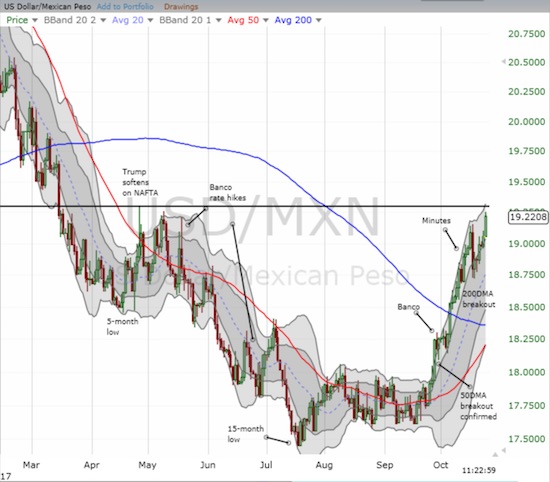
Source: FreeStockCharts.com
Most importantly, USD/MXN has now erased the losses from the last two rate hikes from the Bank of Mexico. USD/MXN now trades back to where it was in the April/May congestion period when the peso churned over NAFTA concerns and the May rate hike. If USD/MXN punches through the horizontal line in the chart above, there will again be little resistance to impede further upside. After such a breakout, the next level to watch is the 20.2 area around the bottom of the approximate head and shoulders (H&S) pattern that marked the 2017 top for USD/MXN (not shown in the above chart).
I was correct to put the Mexican peso on a “short leash” two months ago. Here, I am betting that the current run-up will lose steam as the carry trade begins to look more and more attractive. The stop is of course above 19.30 or so.
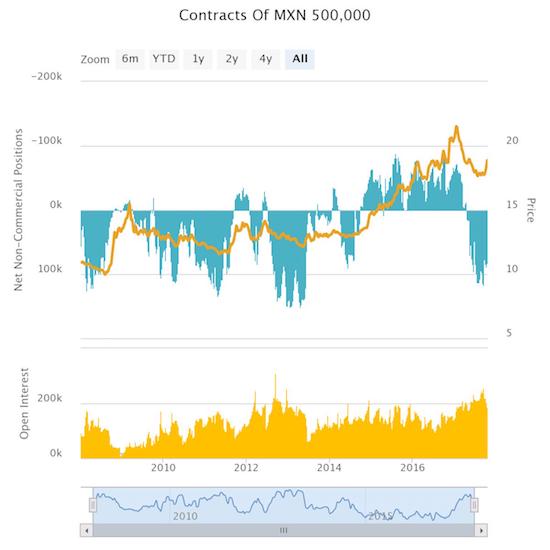
Source: Oanda’s CFTC’s Commitments of Traders
Be careful out there!
Full disclosure: short USD/MXN