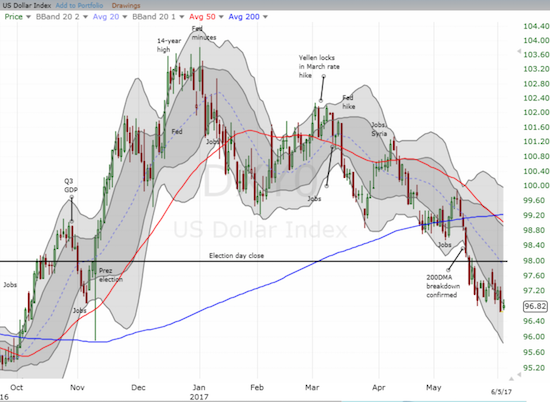
My bearishness on the U.S. dollar index (DXY0) continues as two currency positions in particular have delivered against the U.S. dollar.
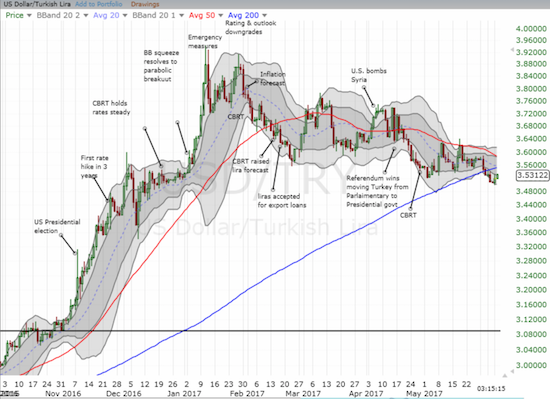
A month ago I wrote about the Turkish Lira (USD/TRY) and suggested that the high-yielding currency pair would eventually crack below support at its 200-day moving average (DMA). USD/TRY delivered at the end of May.

I decided to cover my position last week because currency pairs can experience sharp counter-trend moves after reaching or breaking an important milestone. I believe such a move is underway at the time of writing, and I am fading with a small short position. I am keeping the position small because of the coming meeting of the U.S. Federal Reserve. While financial markets are near certain about a rate hike at this meeting, the market’s reaction to this move is far from certain. I want to keep any dollar positions relatively small going into that meeting. Once USD/TRY follows through with a new low, I will get aggressively short as such a move will confirm a major break of 200DMA support.
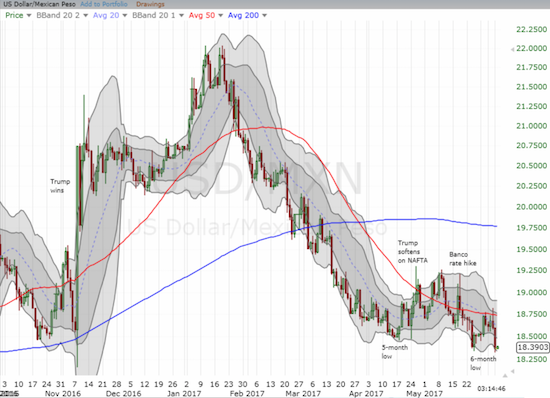
The Mexican peso is the other high-yielding currency I have used to short the U.S. dollar. At the end of May I described fading the bounce in USD/MXN into resistance at its 50DMA. That trade turned out well, and I closed out that position on the retest of last month’s 6-month low.

Just as with the Turkish lira, I covered and took profits because I suspected USD/MXN might not be up to the task of follow-through. At the time of writing, a small bounce indeed seems underway. Also like the Turkish lira, I am anticipating a follow-through low on USD/MXN to signal a major new downward swing in the currency pair.
I like these high-yielding plays against the U.S. dollar because I get a good payout in carry while waiting out the next anticipated move. The general downtrend in the U.S. dollar index also means that carry trades will have a tendency to perform well.

Source for charts: FreeStockCharts.com
This Thursday includes major caveat to forex trades. A real trifecta of potentially major market-moving events will come in the form of 1) the next meeting for the European Central Bank (ECB), 2) testimony at the Senate Intelligence Committee from former FBI Director James Comey on his investigation into Russian meddling in U.S. elections along with commentary on his dealings with President Donald Trump on the matter, and 3) the snap election in the United Kingdom. Needless to say, I am “staying small” going into Thursday!
Be careful out there!
Full disclosure: short USD/TRY

Dear Doc, a question: For USD/TRY pair your 200 DMA value is just around 3.55 on your graph but when I look at graphs provided by certain analysis sites it seems to be around 3.45. What is the source of this discrepancy?
Thanks.
I use a simple moving average. Some folks prefer an exponential moving average. It results in small differences in sensitivity to trends and trend changes. Please send an example and maybe I will be able to better determine what’s going on.
Here’s a screenshot from Net Dania app. I hope it helps.
http://img.photobucket.com/albums/v180/zumanon/cf7c28dc22c910d5081730883a529858.jpg
Strange! So the legend suggests 3.45 is a simple moving average (SMA) of 200 days so it should be the same as the line I use. I adjusted my graph for EMA and also tried calculating off the average of the high, low, and (high+close+low)/3, nothing even comes close to your line. I even changed my scaling from log to arithmetic. I am truly baffled.
We can try another comparison using a different pair on a different platform. Stockcharts.com does not have $USDTRY, but let’s compare with $GBPJPY. The 200MA there is 138.8 and on freestockcharts.com it is 140.2. I used forex.com and it is consistent with stockcharts.com. So it does indeed something is screwy with freestockcharts.com! I will have to send an inquiry and let you know what they tell me.
(I compared with some stocks and see small discrepancies but not nearly as dramatic as with the currencies)
Thanks for this catch!
Adding to the mystery – Yahoo Finance is consistent with freestockcharts.com on stocks but not currencies. I now suspect that the definition of the close is different. I think freestockcharts.com uses midnight Eastern U.S. time to define the close for currencies. Perhaps these other charts use different times. Still, I wouldn’t expect such a large discrepancy. Stay tuned!
So FreeStockCharts.com got back to me. They essentially confirmed that the forex differences are likely a result of a different definition of the close of trading for the day. I am guessing some chart programs use 4pm Eastern when U.S. trading closes. FreeStockCharts.com uses midnight Eastern. I will have to make a footnote on that since the different definitions means that the moving averages should be interpreted with great care.
On the stock charts, it seems that some charting programs incorporate the impact of dividends.
Dear Doc, here’s the GBP/JPY 200 SMA chart again from Net Dania and it confirms your figure of 138.80 : http://img.photobucket.com/albums/v180/zumanon/9b5c69fe35e177efb29bb5c8ea297788.jpg
Does this discrepancy affect your verdict on the USD/TRY?
Thanks.
My verdict remains the same. I have not had problems (in general) with the technicals as defined by the U.S. Eastern time zone midnight close, so I am comfortable sticking with it. However, it does make sense to be more mindful of the less liquid currencies which US traders may not follow as much.