
(This is an excerpt from an article I originally published on Seeking Alpha on March 28, 2016. Click here to read the entire piece.)
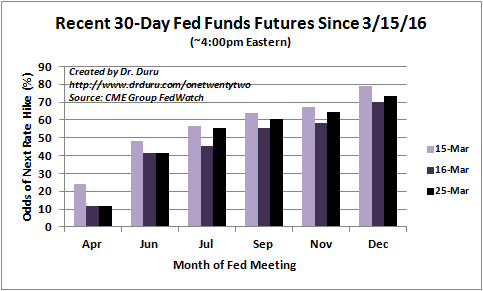
Last December, I wrote about the shaky prospects for the seasonal trade on home builders. Sure enough, iShares US Home Construction (ITB) has not performed this badly on an absolute or relative basis, as measured from the end of October, since 2009.
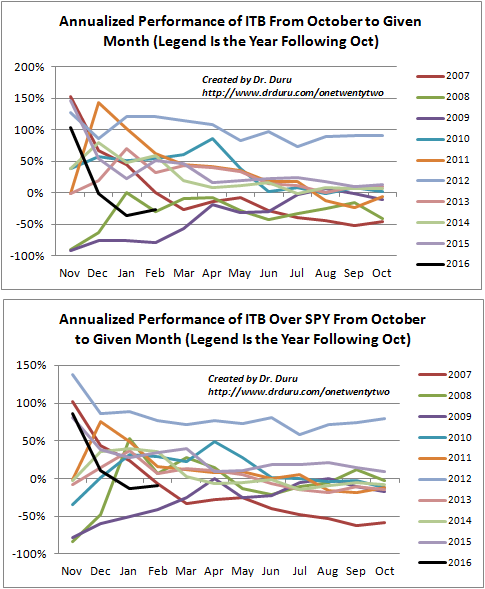
Source for price: Yahoo Finance
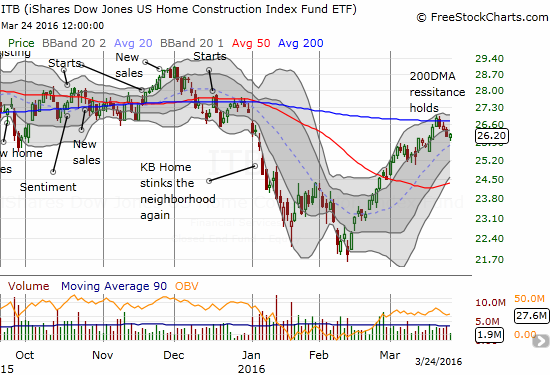
When I wrote about the shaky prospects for this trade, I pointed to likely headwinds from the market’s expectations on rate hikes from the U.S. Federal Reserve. Those rate expectations have swung wildly in 2016 from a market that pushed out the next rate hike to 2017 to the current market that just pushed the first rate hike back to July, 2016.
Source: CME Group FedWatch
Given these changes, I cannot blame ITB’s problems on interest rates per se. Indeed, ITB, along with the S&P 500 (SPY) has rallied along with expectations for an earlier and earlier date for the next rate hike.
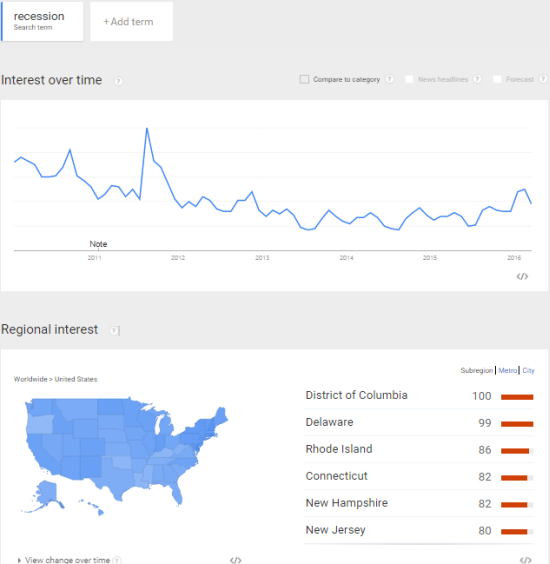
Source: FreeStockCharts.com
If the market can rally along with increasing rate expectations, I have to assume economic expectations are at work. {snip}
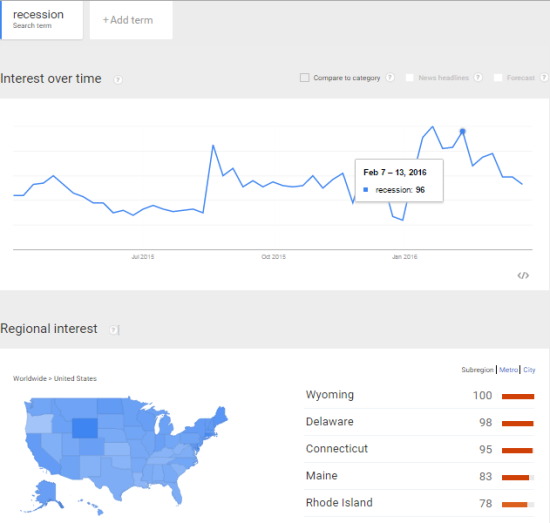
Source: Google Trends
{snip}
Anyway, a more directly quantitative view of recession fears… {snip}
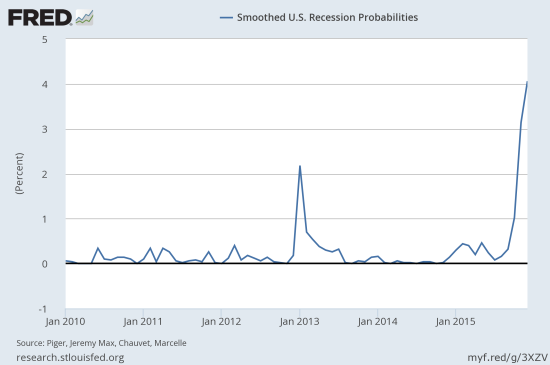
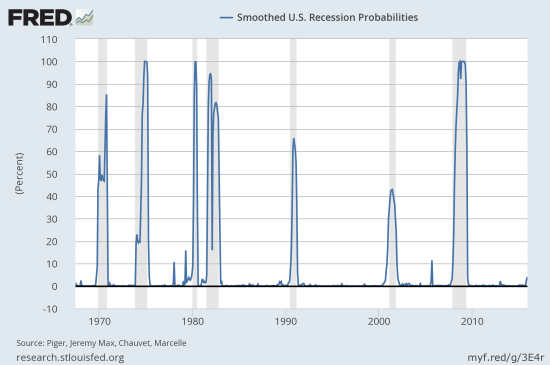
Source: Piger, Jeremy Max and Chauvet, Marcelle, Smoothed U.S. Recession Probabilities [RECPROUSM156N], retrieved from FRED, Federal Reserve Bank of St. Louis, March 27, 2016.
While the data points for the first months of 2016 are not yet available, I think it is safe to say that the market exhibited extreme sensitivity to the increase of recession odds from near zero. {snip}
Be careful out there!
Full disclosure: long ITB call options
(This is an excerpt from an article I originally published on Seeking Alpha on March 28, 2016. Click here to read the entire piece.)