
(T2108 measures the percentage of stocks trading above their respective 40-day moving averages [DMAs]. It helps to identify extremes in market sentiment that are likely to reverse. To learn more about it, see my T2108 Resource Page. You can follow real-time T2108 commentary on twitter using the #T2108 hashtag. T2108-related trades and other trades are occasionally posted on twitter using the #120trade hashtag. T2107 measures the percentage of stocks trading above their respective 200DMAs)
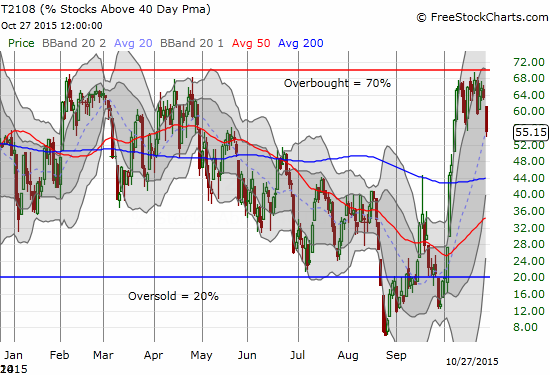
T2108 Status: 55.2%
T2107 Status: 30.6%
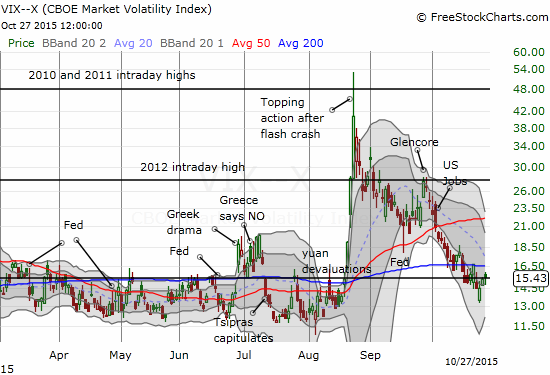
VIX Status: 15.4
General (Short-term) Trading Call: neutral, changed from mildly bearish – see below
Active T2108 periods: Day #18 over 20%, Day #17 over 30%, Day #17 over 40%, Day #15 over 50% (overperiod), Day #1 under 60% (underperiod), Day #332 under 70%
Reference Charts (click for view of last 6 months from Stockcharts.com):
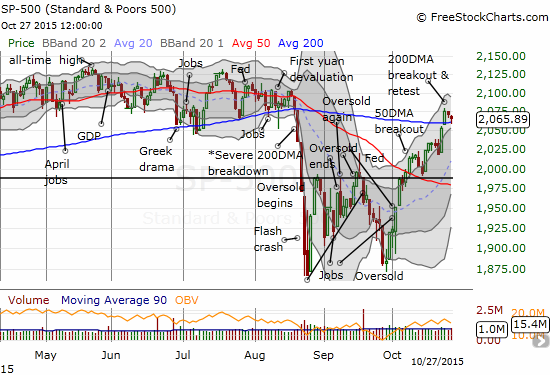
S&P 500 or SPY
SDS (ProShares UltraShort S&P500)
U.S. Dollar Index (volatility index)
EEM (iShares MSCI Emerging Markets)
VIX (volatility index)
VXX (iPath S&P 500 VIX Short-Term Futures ETN)
EWG (iShares MSCI Germany Index Fund)
CAT (Caterpillar).
IBB (iShares Nasdaq Biotechnology).
Commentary
The day before the Federal Reserve issues yet another decision on monetary policy, the stock market took a turn that raised red flags.
T2108, my favorite technical indicator, plunged to its lowest level in almost three weeks. This move suggests that T2108 will NOT flip overbought anytime soon after all.
The S&P 500 (SPY) did not follow this sharp move. Instead, the index “gently” pulled back to 200DMA support and neatly bounced from there into the close.
The volatility index, the VIX, traded up a mere 0.9% to close just above its pivot line. So no alarm is present here (meaning that there is little point in playing my typical “fade volatility” pre/post-Fed trade).
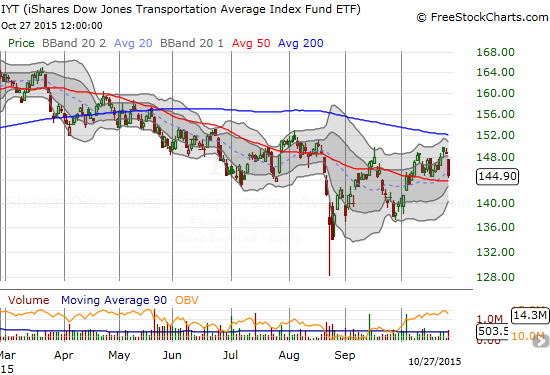
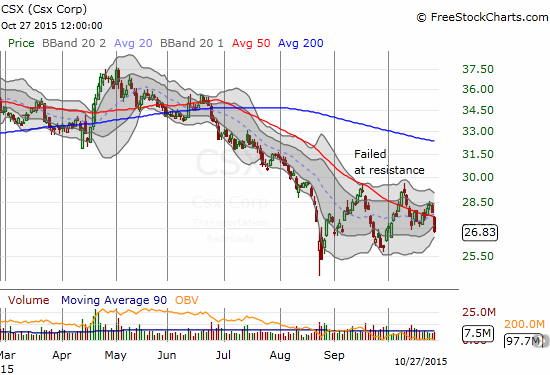
Only the transports provided clear confirmation that underlying technicals for the market took a turn for the worse on the day. The iShares Transportation Average ETF (IYT) dropped 2.7% although it did manage to close above its 50DMA support. Railroad CSX Corp. (CSX) was not so lucky at the end of its 3.8% loss on the day.
I would be very prepared to get more aggressive with short positions if not for the Federal Reserve meeting on Wednesday, October 28, 2015. As usual, I expect the Fed to work its magic to try to soothe any outstanding fears out in the market. However, the volatility index did not increase enough going into the meeting to make a good risk/reward trade to fade volatility. So, I am stuck in neutral until the Fed ushers down its latest declarations.
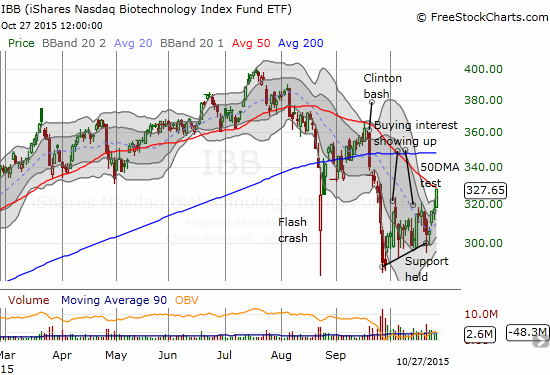
The iShares Nasdaq Biotechnology ETF (IBB) also ran contrary to my bias to get more bearish given T2108’s plunge. IBB continues to show more life. It rallied for a 3.2% gain on the day in an impressive show of relative strength. IBB closed right at its 50DMA resistance so follow-through in the next few days will be key. Note that I sold my last IBB-related position on the spike higher on the previous day. That includes Gilead – I decided not to risk holding the call options through earnings.
Daily T2108 vs the S&P 500
")
Black line: T2108 (measured on the right); Green line: S&P 500 (for comparative purposes)
Red line: T2108 Overbought (70%); Blue line: T2108 Oversold (20%)
Weekly T2108

*All charts created using freestockcharts.com unless otherwise stated
The charts above are the my LATEST updates independent of the date of this given T2108 post. For my latest T2108 post click here.
Related links:
The T2108 Resource Page
Expanded daily chart of T2108 versus the S&P 500
Expanded weekly chart of T2108
Be careful out there!
Full disclosure: no positions