
(T2108 measures the percentage of stocks trading above their respective 40-day moving averages [DMAs]. It helps to identify extremes in market sentiment that are likely to reverse. To learn more about it, see my T2108 Resource Page. You can follow real-time T2108 commentary on twitter using the #T2108 hashtag. T2108-related trades and other trades are occasionally posted on twitter using the #120trade hashtag. T2107 measures the percentage of stocks trading above their respective 200DMAs)
T2108 Status: 65.6%
T2107 Status: 32.9%
VIX Status: 14.5
General (Short-term) Trading Call: neutral, changed from mildly bearish – see below
Active T2108 periods: Day #16 over 20%, Day #15 over 30%, Day #15 over 40%, Day #13 over 50%, Day #2 over 60% (overperiod), Day #330 under 70%
Reference Charts (click for view of last 6 months from Stockcharts.com):
S&P 500 or SPY
SDS (ProShares UltraShort S&P500)
U.S. Dollar Index (volatility index)
EEM (iShares MSCI Emerging Markets)
VIX (volatility index)
VXX (iPath S&P 500 VIX Short-Term Futures ETN)
EWG (iShares MSCI Germany Index Fund)
CAT (Caterpillar).
IBB (iShares Nasdaq Biotechnology).
Commentary
This was another of those surprising market days.
The S&P 500 (SPY) achieved a HUGE milestone by CLEANLY breaking out above its 200DMA while at the same time completely reversing all the loss from the severe 200DMA breakdown on August 20, 2015. It was of course this breakdown that led to three oversold periods and a flash crash.
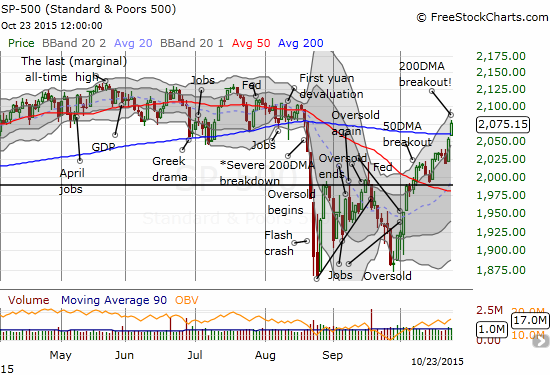
NORMALLY, this breakout would be cause for celebration, but T2108 is holding me back. Despite another substantial gain on the S&P 500, 1.6% the previous day and 1.1% today, T2108 has STILL not crossed the overbought threshold. T2108 barely increased as it moved from 63.8% to 65.6%. At its high, T2108 hit 67.4%. This level was still lower than four other trading days over these past two weeks where T2108 has bounced around just below the overbought threshold. For me, this is a wonder to behold. It keeps open the possibility that the market will run out of the gas needed to power through an overbought rally.
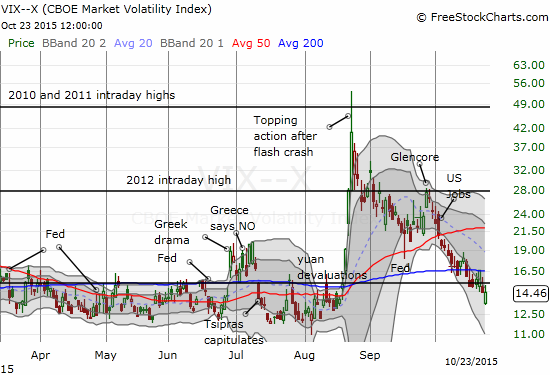
The volatility index, the VIX, added to the day’s surprise. It gapped down but rallied into the close of the day and ended flat.
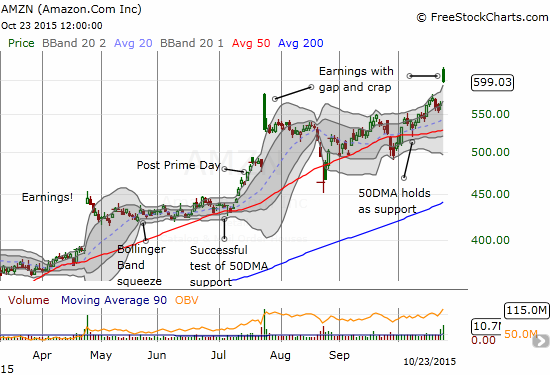
Earnings from Amazon.com (AMZN), Alphabet (GOOG), and Microsoft (MSFT) provided clear inspiration for the rally. I went after AMZN with success although I let the profit from my second trade on the day fade in anticipation of a greater opportunity next week. The gap and crap on AMZN is eerily reminiscent of Q2’s earnings.
An even more important inspiration on the day was yet another “surprise” interest rate cut from China, another record low. Economic conditions must truly be dire across the Pacific given all the measures the government has taken over the past year or so. We truly live in an economic bizarro world when a nation supposedly growing around 7% a year is easing monetary policies and stuffing stockings with economic stimulus like a recession is just over the horizon. In other words, growth simply cannot be as high as reported.
Anyway, the rate cut is a more important prop than the missing props I discussed earlier this week for Wynn Resorts (WYNN) and Sinosteel. China-related stocks of course got a big boost. Some of that euphoria likely spilled over into other stocks and combined with the continuing after-effect of the European Central Bank’s reassuring decision on monetary policy. The prospect of further monetary policy divergence drove the U.S. dollar index (UUP) right into the downtrend that I thought would hold firm.
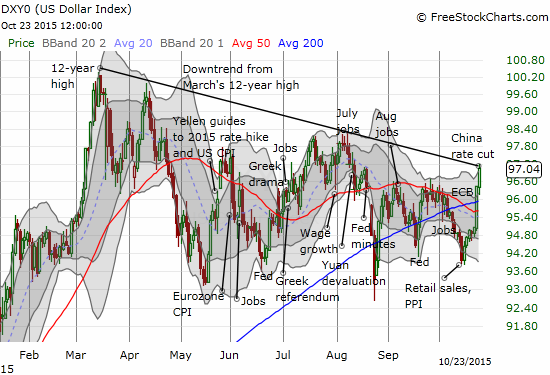
Given all the hand-wringing in the past about the impact of a strong dollar on corporate earnings, I think the dual strong rallies in the S&P 500 and the U.S. dollar make for strange partners. Traders should watch out for a potential resolution of this contrast. Perhaps the strong dollar does not really matter as much as we might have thought.
Next up, the Federal Reserve gets its chance to weigh in this last week of October. Without a scheduled press conference, the Fed is free to deliver a very generic and non-committal decision that will help them punt one more time on a specific point for a first rate hike.
I changed the short-term trading call to neutral from “mildly bearish” in deference to the 200DMA breakout. I am not bullish because T2108 has yet to hit overbought. I may go to bullish if T2108 flips overbought along with follow-through for the S&P 500. I know this sounds counter-intuitive given overbought is supposed to be synonymous with over-extended and a time to sell. However, the S&P 500 has had some of its strongest, most persistent rallies while overbought. This history explains why I cannot get on board with the breakout until buyers are strong enough to push more stocks into stronger technical positions. The 200DMA provides a perfect bear/bull dividing line for making this nuanced call on interpreting over-bought conditions. There is absolutely NO reason to aggressively act on the “mildly bearish” short-term trading call until the S&P 500 closes below its 200DMA again.
Daily T2108 vs the S&P 500
")
Black line: T2108 (measured on the right); Green line: S&P 500 (for comparative purposes)
Red line: T2108 Overbought (70%); Blue line: T2108 Oversold (20%)
Weekly T2108

*All charts created using freestockcharts.com unless otherwise stated
The charts above are the my LATEST updates independent of the date of this given T2108 post. For my latest T2108 post click here.
Related links:
The T2108 Resource Page
Expanded daily chart of T2108 versus the S&P 500
Expanded weekly chart of T2108
Be careful out there!
Full disclosure: