
(T2108 measures the percentage of stocks trading above their respective 40-day moving averages [DMAs]. It helps to identify extremes in market sentiment that are likely to reverse. To learn more about it, see my T2108 Resource Page. You can follow real-time T2108 commentary on twitter using the #T2108 hashtag. T2108-related trades and other trades are occasionally posted on twitter using the #120trade hashtag. T2107 measures the percentage of stocks trading above their respective 200DMAs)
T2108 Status: 59.6%
T2107 Status: 30.0%
VIX Status: 16.7
General (Short-term) Trading Call: MILDLY bearish
Active T2108 periods: Day #14 over 20%, Day #13 over 30%, Day #13 over 40%, Day #11 over 50%, Day #1 under 60% (ending 4 days above 60%, including intraday high of 69.6%), Day #328 under 70%
Reference Charts (click for view of last 6 months from Stockcharts.com):
S&P 500 or SPY
SDS (ProShares UltraShort S&P500)
U.S. Dollar Index (volatility index)
EEM (iShares MSCI Emerging Markets)
VIX (volatility index)
VXX (iPath S&P 500 VIX Short-Term Futures ETN)
EWG (iShares MSCI Germany Index Fund)
CAT (Caterpillar).
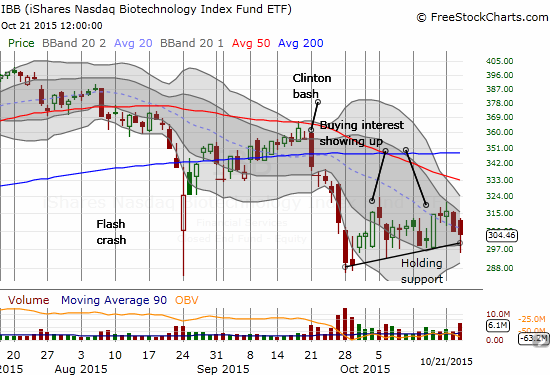
IBB (iShares Nasdaq Biotechnology).
Commentary
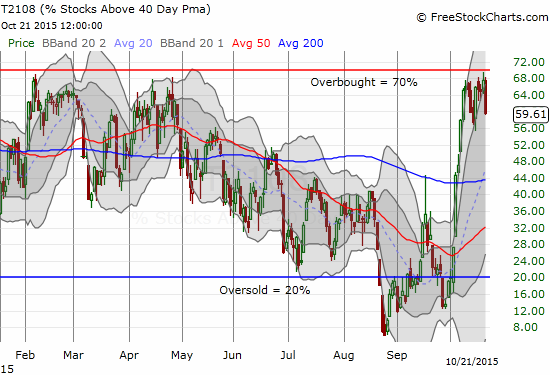
With the August Angst at an “official” end, the bears/sellers are clearly getting more restless. My favorite technical indicator, T2108, brushed right by overbought conditions on Tuesday, October 20th with an intraday high of 69.6%. I am thinking of rounding this to 70% and calling it overbought based on the definitive pullback from overbought conditions the following day.
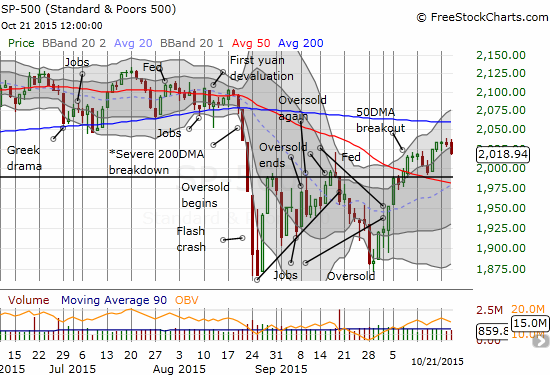
While the S&P 500 (SPY) declined right along T2108, it was only a 0.6% loss. Having T2108 allows me to see a greater danger in the current (short-term) trading conditions. I am thinking a test of 50DMA support is now a lot more likely to happen before a test of resistance at the 200DMA. Note the rapidly rising 20DMA in the chart below that could provide additional support on a dip.
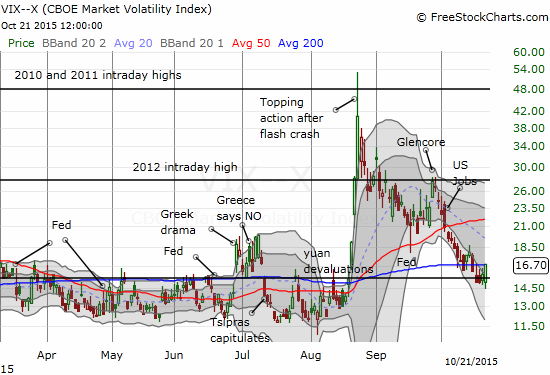
The volatility index, the VIX, also added to a more bearish picture. It popped 6.0% and closed above the 15.35 pivot.
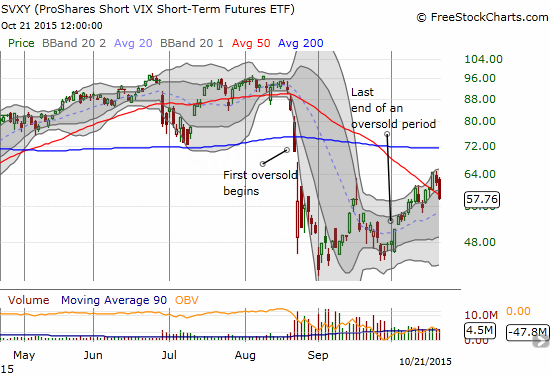
Fortunately, I had my shares of ProShares Short VIX Short-Term Futures (SVXY) up for sale this week. So when Monday’s momentum came to a screeching halt on Tuesday, I had no qualms about selling right away. That brings a complete end to all my purchases during the oversold periods. This lighter load makes it even easier for me to change the short-term trading call from neutral to mildly bearish.
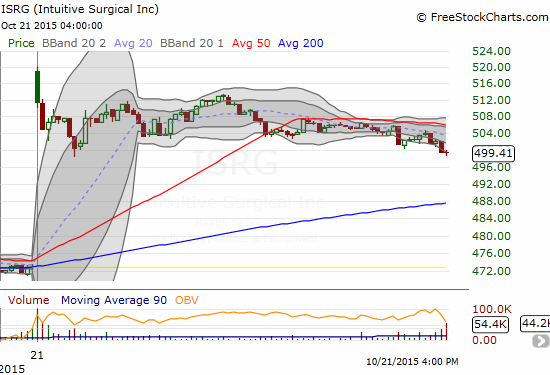
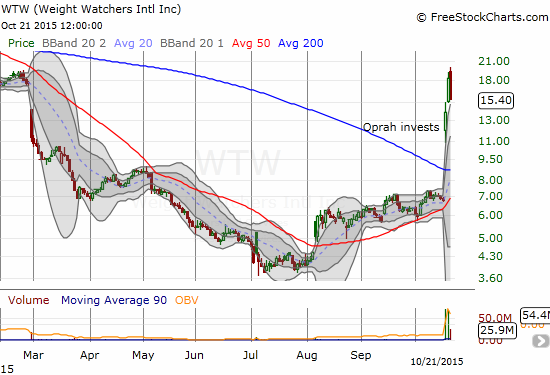
The change in trading bias means that I am now more inclined to look for bearish trades than bullish ones. However, I am still very willing to go long opportunistically. Such an opportunity seemed to present itself with the post-earnings gap up on Intuitive Surgical (ISRG). As I explained with my post gap up trade in Weight Watchers (WTW), I am now much more willing to trade with momentum on such moves. ISRG though was VERY tricky. The stock tends to have a wide spread which presents difficulties for trading quickly. I used a limit buy order and had to choose between the obvious point of $500 or some level just above the 50 or 200DMA. I chose the 200DMA and was fortunate to exit with profit.
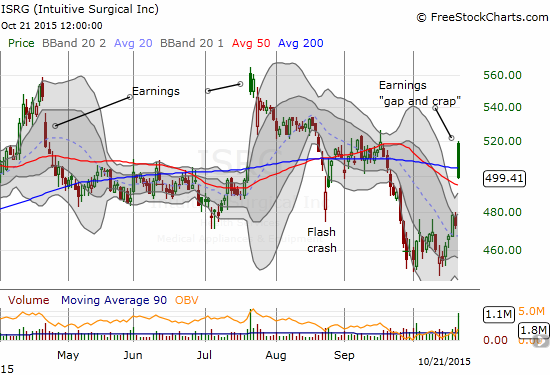
As long as ISRG can hold 50DMA support, it remains on my buy list even with the mildly bearish trading call for the general market. ISRG flips to bearish if it completely fills its post-earnings gap.
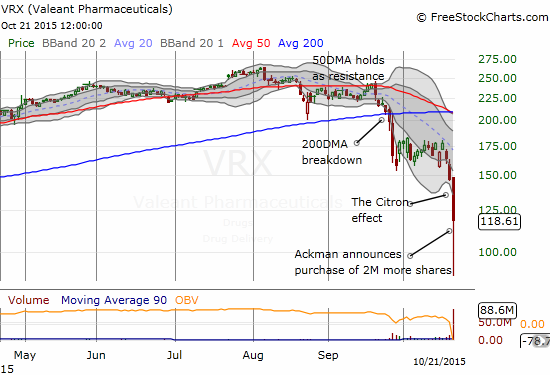
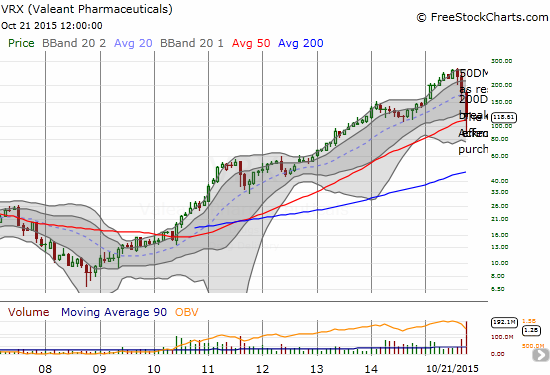
The healthcare industry was the source of even more stark drama. Infamous short-selling firm Citron Research struck again. This time the target was Valeant Pharmaceuticals (VRX). Citron accused VRX of phantom sales. The stock faced intense and near continuous selling pressure until trading was finally halted around 1:30pm Eastern. After that, buyers boldly stepped in and turned an insanely severe 39.7% loss into a more modest 19.2% loss by the close. News also arrived that VRX investor and money manager Bill Ackman loaded up on another 2 million shares.
While I was not watching the action in VRX, I WAS tracking the iShares Nasdaq Biotechnology ETF (IBB). Based on what I see as the very slow return of buying interest into IBB, I have been preparing a new entry with a different trading mindset. I am now building a position with shares so that I can better ride out what looks like a much longer time to reverse the Clinton Bash than I originally anticipated. I am also going to keep trying call options but with a much shorter timeframe than before. It so happened that $300 was “close enough” to a bottom on the day. As a bonus, a limit order on my call options triggered soon after that. A lack of liquidity prevented me from exiting the call options at the close at the price I wanted. I will be trying again Thursday and Friday.
I still have an eye on Weight Watchers (WTW) for trading opportunities. Today, the persistent buying pressure came to a climactic end. A 15.6% loss returned WTW to its upper-Bollinger Band. This SHOULD begin a period of consolidation. If I make any more trades in the near-term, they will still have to be opportunistic (and likely quick) trades.
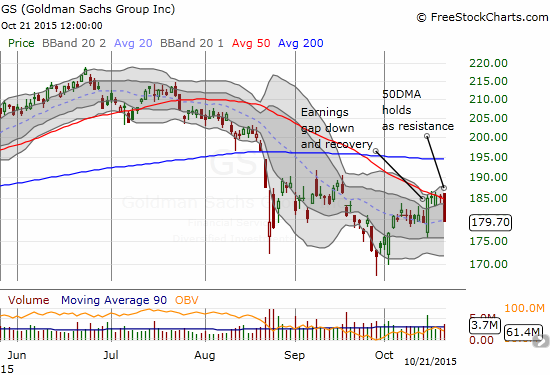
This was an odd day to turn mildly bearish since I mostly saw opportunities to make buys. Goldman Sachs (GS) was one short I should have been ready to trade.
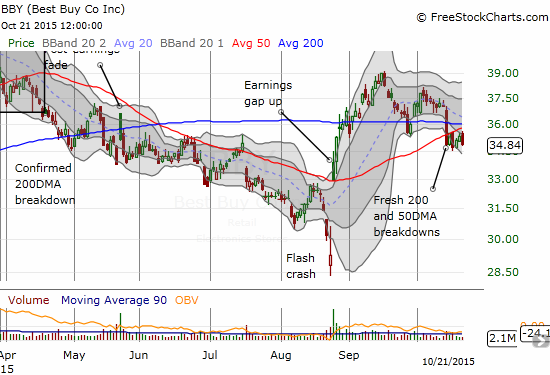
On the consumer side of things, Best Buy (BBY) is hanging precariously on the edge of a major breakdown. The post-earnings celebrations may be coming to an end.
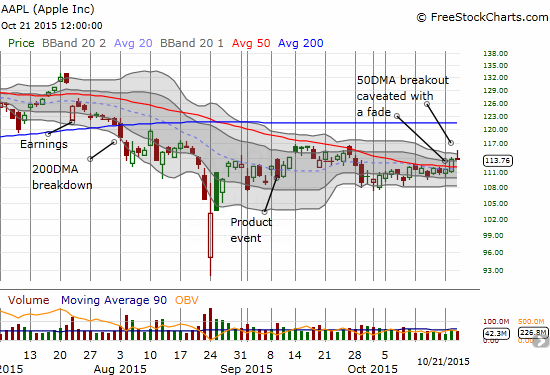
Finally, I started the day bullish on AAPL as it was following through on Tuesday’s 50DMA breakout in convincing fashion. Instead of completing the move, AAPL faded and finished the day slightly in the red. Since the 50DMA is still intact as support, I am not returning to a bearish bias on the stock just yet. However, note well that AAPL seems to be exhibiting its typical buyer’s bias ahead of earnings. See “The Apple Pre-Earnings Trade: October, 2015 Edition – An Important Juncture” for more detais on my assessment of this quarter’s pre-earnings trade on AAPL.
Daily T2108 vs the S&P 500
")
Black line: T2108 (measured on the right); Green line: S&P 500 (for comparative purposes)
Red line: T2108 Overbought (70%); Blue line: T2108 Oversold (20%)
Weekly T2108

*All charts created using freestockcharts.com unless otherwise stated
The charts above are the my LATEST updates independent of the date of this given T2108 post. For my latest T2108 post click here.
Related links:
The T2108 Resource Page
Expanded daily chart of T2108 versus the S&P 500
Expanded weekly chart of T2108
Be careful out there!
Full disclosure: long SVXY, long IBB call options
Regarding calling 69.6% intraday as oversold: I say don’t. Intraday highs and closing prices are very different things.
I forgot to add that I am tempted to call this close enough because there have been several times in the past where T2108 almost hit overbought, failed to do so, and sold off from there. T2108 has not been overbought for 328 trading days. So loosening up the definition seems to make sense.
As I am typing, the market has nicely reversed. T2108 is now over 66%….
I can’t wait to write my next update. The market today really turned on a dime! Another reminder of why it is important to keep the head on a swivel during earnings season.