
(T2108 measures the percentage of stocks trading above their respective 40-day moving averages [DMAs]. It helps to identify extremes in market sentiment that are likely to reverse. To learn more about it, see my T2108 Resource Page. You can follow real-time T2108 commentary on twitter using the #T2108 hashtag. T2108-related trades and other trades are occasionally posted on twitter using the #120trade hashtag. T2107 measures the percentage of stocks trading above their respective 200DMAs)
T2108 Status: 53.3%
T2107 Status: 54.4%
VIX Status: 12.1
General (Short-term) Trading Call: Neutral. S&P 500 is setup for a fresh run-up.
Active T2108 periods: Day #148 over 20%, Day #107 above 30%, Day #51 above 40%, Day #6 over 50% (overperiod), Day #17 under 60%, Day #217 under 70%
Reference Charts (click for view of last 6 months from Stockcharts.com):
S&P 500 or SPY
SDS (ProShares UltraShort S&P500)
U.S. Dollar Index (volatility index)
EEM (iShares MSCI Emerging Markets)
VIX (volatility index)
VXX (iPath S&P 500 VIX Short-Term Futures ETN)
EWG (iShares MSCI Germany Index Fund)
CAT (Caterpillar).
Commentary
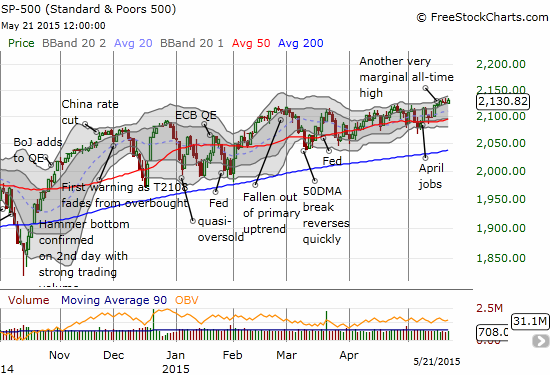
I almost missed it. T2108 pulled off a move in the past week unseen since December when my favorite technical indicator almost hit oversold status: T2108 gained for three and then four days in a row until Tuesday, May 19th’s small blip. T2108 has chopped since then (surprise, surprise) and closed today at 53.3%. The S&P 500’s rare feat was to follow up a marginal all-time high with a more convincing one. Three days of gains starting from last Thursday pushed the S&P 500 (SPY) into the upper band of its trading channel (chopping channel). Combined with T2108 still 17 percentage points away from overbought, the stage is set for a new run-up.
Volatility remains the main blocker for me to fully accept the possibility that a fresh run-up is around the corner. My hesitation over trying to go long volatility last week was fully justified by this week’s performance. The VIX went absolutely nowhere after my trade and helped to keep pushing ProShares Ultra VIX Short-Term Futures (UVXY) ever lower. Today was the body blow with the VIX finally making a move…down. The VIX closed at a fresh low for the year.

Of course, theoretically, the VIX can continue falling. It hit 10.4 last July and marked a 7 1/2 year low. That is just not a bet I am comfortable making when I see plenty of reasons why volatility SHOULD take a 180 degree turn at any time.
As usual, there are interesting individual charts to trade even if the overall indices continue to refuse to cooperate with good risk/reward entries (long or short). First note from my last post on “charts to trade,” I have followed Bollinger Band squeezes to take a long-term call spread position on Fortinet (FTNT) and a short-term put position on Intuitive Surgical (ISRG). The latter was tough, but I had to follow the technicals. I also bought on the first sign of weakness on Hortonworks (HDP).
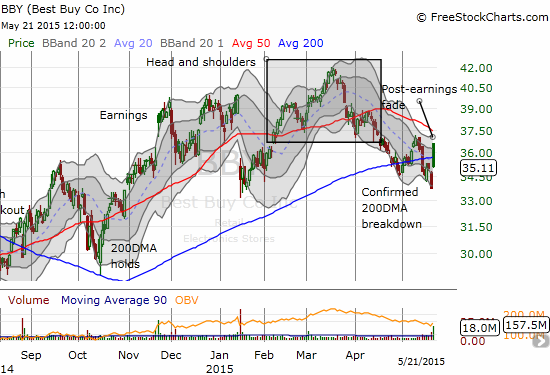
Best Buy (BBY)
When I featured BBY last week, I pointed out a bearish technical breakdown heading into earnings. Yesterday, the stock convincingly followed through on that weakness just ahead of earnings. Following earnings, BBY promptly gapped up over 7%. However, i faded the move immediately. BBY has a habit of getting faded on positive moves and today’s was a big one. The fade was bad enough to send BBY under its 200DMA again. Note how the high of the move came short of the previous high and neatly ended under the declining 50DMA. I closed my position to lock up profits, but I have the stock tagged for more fades if the opportunity arises.
Amazon.com (AMZN)
While the market was busy fading BBY, its favorite competitor AMZN was breaking upward through a Bollinger Band (BB) squeeze. This looks like the beginning of bullish follow-through to last month’s huge post-earnings gap up. I still have to chuckle remembering all the shock and panic that ensued when AMZN reported poor earnings last October. That was supposed to be the moment investors finally got fed up with AMZN’s profitless growth. The stock is up 51% since then.
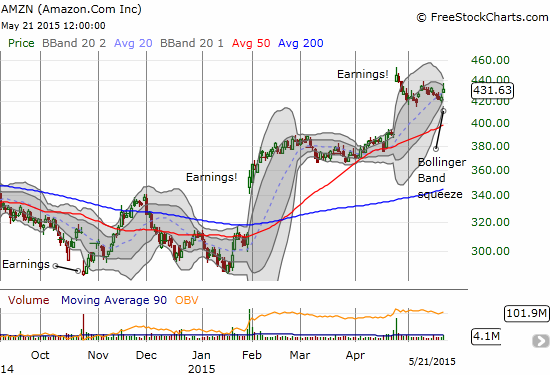
Like my bullish bias on Netflix (NFLX) thanks to technicals, I plan to buy dips on AMZN aggressively going forward for quick swing trades on call options.
Daily T2108 vs the S&P 500
")
Black line: T2108 (measured on the right); Green line: S&P 500 (for comparative purposes)
Red line: T2108 Overbought (70%); Blue line: T2108 Oversold (20%)
Weekly T2108

*All charts created using freestockcharts.com unless otherwise stated
The T2108 Resource Page
Expanded daily chart of T2108 versus the S&P 500
Expanded weekly chart of T2108
Be careful out there!
Full disclosure: long UVXY call options, short EUR/USD, long TLT call spread