(T2108 measures the percentage of stocks trading above their respective 40-day moving averages [DMAs]. It helps to identify extremes in market sentiment that are likely to reverse. To learn more about it, see my T2108 Resource Page. You can follow real-time T2108 commentary on twitter using the #T2108 hashtag. T2108-related trades and other trades are occasionally posted on twitter using the #120trade hashtag. T2107 measures the percentage of stocks trading above their respective 200DMAs)
T2108 Status: 63.9%
T2107 Status: 52.8%
VIX Status: 13.3
General (Short-term) Trading Call: Mildly bearish – STILL waiting to see what happens when/if T2108 becomes overbought. Solidly bearish on a S&P 500 close below 2085.
Active T2108 periods: Day #90 over 20%, Day #49 above 30%, Day #29 over 40%, Day #11 (corrected) over 60% (overperiod), Day #160 under 70%
Reference Charts (click for view of last 6 months from Stockcharts.com):
S&P 500 or SPY
SDS (ProShares UltraShort S&P500)
U.S. Dollar Index (volatility index)
EEM (iShares MSCI Emerging Markets)
VIX (volatility index)
VXX (iPath S&P 500 VIX Short-Term Futures ETN)
EWG (iShares MSCI Germany Index Fund)
CAT (Caterpillar).
Commentary
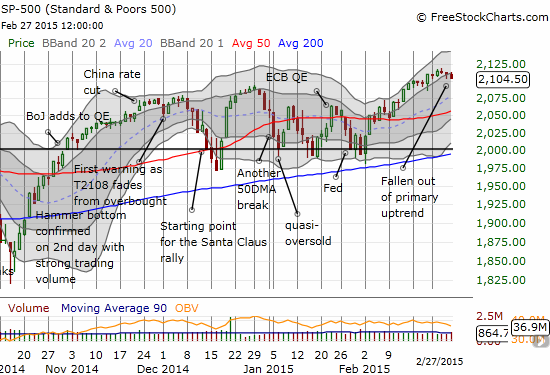
It was another day of very marginal moves, except this time the S&P 500 (SPY) declined while T2108 gained.
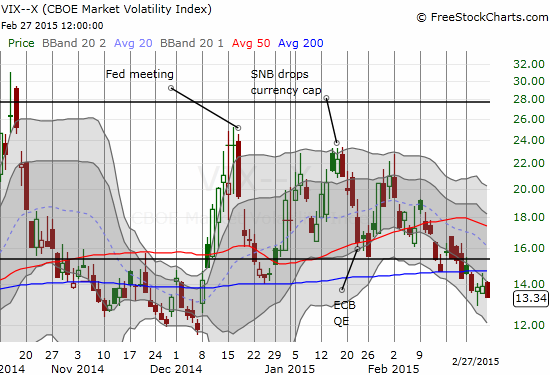
The volatility index surprisingly closed lower, now at a fresh 2 1/2 month low. Earlier, I thought the volatility index, the VIX, was getting ready to hop back over the 15.35 pivot.
Although February ended with a whimper for the S&P 500, the month was overall very strong. The index gained a very respectable 5.5% gain. This strong gain motivated me to zoom out and take a look at the market from a longer-term view. This monthly chart of SPY shows the sheer persistence of this run-up. Note the uptrend distinctly defined by the two upper-Bollinger Bands (BB).
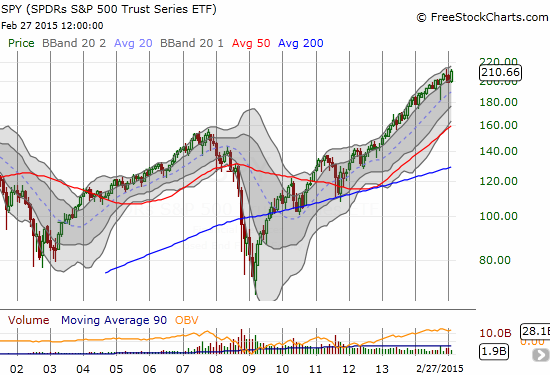
This chart is VERY humbling. It tells me that buy and hold is far from dead. It reminds me how the market “wants” to go up. Most importantly, it demonstrates that today’s uptrend is little different from the uptrend that defined the last long-term run-up. If THIS run-up is anything like the last, then we have at least another year or more to go for this rally (eerily enough, that would position us for another major sell-off to mark a change in U.S. presidential regimes). In 2003, SPY first re-entered the space between the monthly upper-BBs. The ETF pretty much stayed there until the end of 2007. Today’s post-plunge market took a few attempts before it latched onto its uptrend. Since mid-2012, SPY has pretty much stayed on-trend. This view gives me some insight on how to better time shorts (at the top of the channel) and longs (at or near the bottom of the channel). Here is a close-up to make clear the channel behavior:
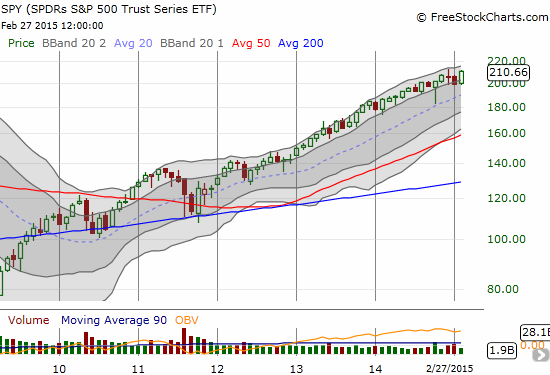
That deep plunge to the 20-month moving average was the sell-off in October. This view makes plain how that selling was a stark outlier in the middle of the overall trend.
OK. Enough of the long-term stuff. Back to what we have immediately in front of us. Here are some telling charts.
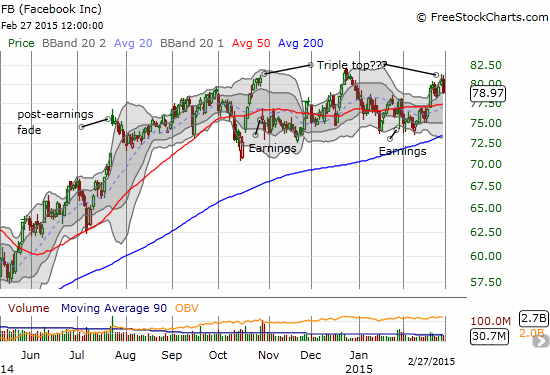
Facebook (FB)
This chart says a thousand words. Did Facebook just triple top? This week, FB looked like it was finally regaining momentum to make another breakout attempt. The high volume selling on Friday was quite surprising to me. Even though the stock remains within an uptrend channel, the selling seems to confirm the third point of a triple top.
Herbalife (HLF)
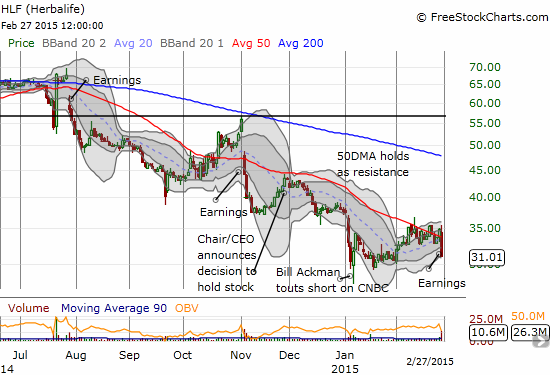
HLF is back on my radar. It has been a while since I last wrote about this controversial stock. My late November piece was timely as HLF triggered a short that culminated in a massive 2-day sell-off in early January. At the time, there was no news to explain the move. On January 7th, it all made sense as Bill Ackman appeared on CNBC to once again tout his short thesis on HLF. True to form, the selling stopped on a dime, and buyers/bulls successfully thumbed their collective noses at Ackman. It was a classic “buy/sell the rumor, sell/buy the news” flip-flop.
HLF returned to my radar as recent headline earnings seemed to convey bad news. Surprisingly, the stock traded up briefly. With the highs sitting at the top of a recent consolidation range and with the 50DMA holding well as resistance since last summer, I used the pop to take a contrary position in put options. Sure enough, the stock faded and closed with a 11% loss. Note that the latest Ackman low is still intact…
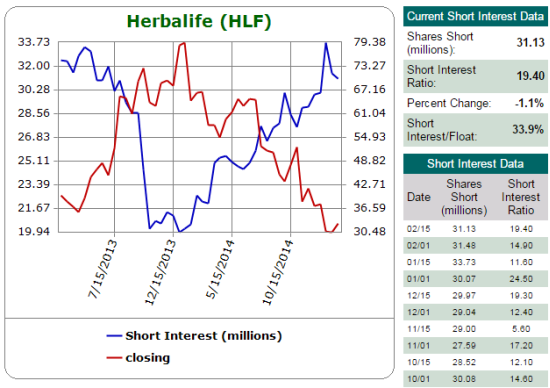
In case you were wondering, shorts have actually backed off a bit recently from HLF. They are now “only” 33.9% of float.
American Express (AXP)
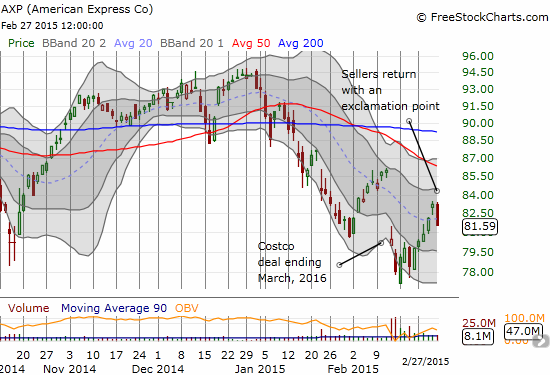
As promised, I sold out of my AXP call options. And apparently just in time. Today’s 1.99% drop formed a classic bearish candle indicating the end of an upward move. I decided to flip allegiances here and bought put options. I will likely double down if I can get the puts for a cheaper price in the next two weeks or so. I gave myself runway again with an April expiration.
Google (GOOG)
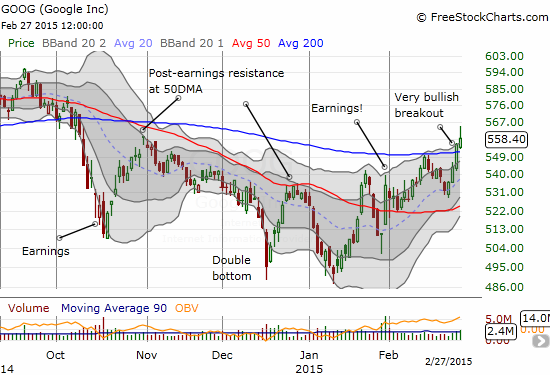
GOOG had an outstanding week, and I completely missed it (ugh!). GOOG broke out above its 200DMA on Thursday; the stock has officially confirmed its double-bottom across December and January. It is now in a “full bull” position. The fade from the highs on Friday is just an opportunity to buy at a better price. Of course, a close below the 200DMA will end the call, but I am willing to give GOOG enough leash to its 50DMA given the enormous potential of a fresh run-up. $600/share anyone?
Splunk (SPLK)
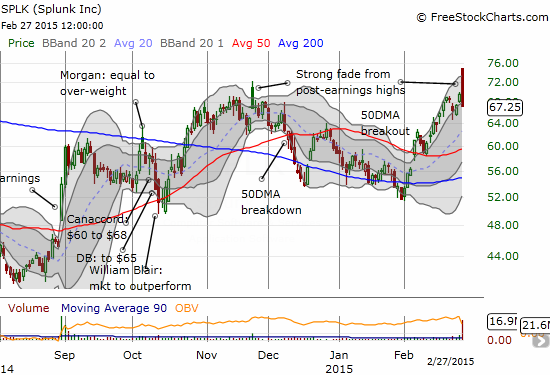
Missing GOOG was bad enough, but I had little excuse for missing this classic and picture-perfect post-earnings fade on Splunk. I remain bearish as ever on SPLK, and I was ready to fade from the post-earnings open. Sellers moved in right from the open. Yet, I was still overly cautious with a low-ball offer on some put options. Needless to say, they never executed (in retrospect, I should have shorted shares but I was simply too wary). SPLK fell almost 10% from highs to lows. This is once again a stock to fade on rallies. Friday’s move was about as bearish as they come: high-volume selling, a bearish engulfing pattern, and a close on the low of the day.
Now, let’s bring on the Spring…!
Daily T2108 vs the S&P 500

Black line: T2108 (measured on the right); Green line: S&P 500 (for comparative purposes)
Red line: T2108 Overbought (70%); Blue line: T2108 Oversold (20%)
Weekly T2108

*All charts created using freestockcharts.com unless otherwise stated
The T2108 Resource Page
Expanded daily chart of T2108 versus the S&P 500
Expanded weekly chart of T2108
Be careful out there!
Full disclosure: short FB and long FB call options, long HLF puts, long AXP puts
