
(T2108 measures the percentage of stocks trading above their respective 40-day moving averages [DMAs]. It helps to identify extremes in market sentiment that are likely to reverse. To learn more about it, see my T2108 Resource Page. You can follow real-time T2108 commentary on twitter using the #T2108 hashtag. T2108-related trades and other trades are sometimes posted on twitter using the #120trade hashtag. T2107 measures the percentage of stocks trading above their respective 200DMAs)
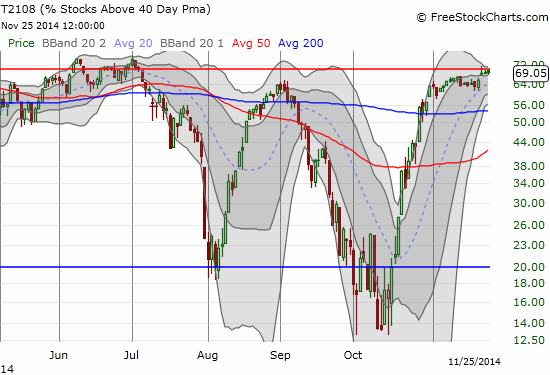
T2108 Status: 69.1%
T2107 Status: 53.8%
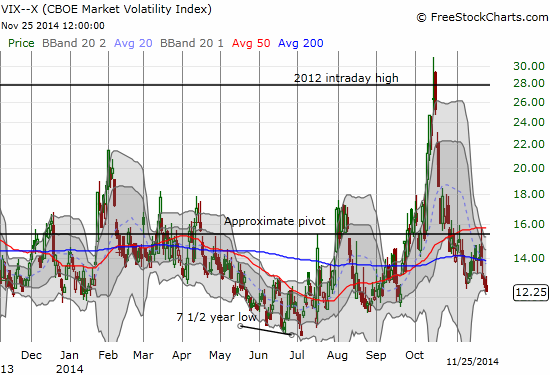
VIX Status: 12.3
General (Short-term) Trading Call: Hold (bullish positions)
Active T2108 periods: Day #27 over 20%, Day #25 over 30%, Day #22 over 40%, Day #20 over 50%, Day #15 over 60% (overperiod), Day #97 under 70% (underperiod)
Reference Charts (click for view of last 6 months from Stockcharts.com):
S&P 500 or SPY
SDS (ProShares UltraShort S&P500)
U.S. Dollar Index (volatility index)
EEM (iShares MSCI Emerging Markets)
VIX (volatility index)
VXX (iPath S&P 500 VIX Short-Term Futures ETN)
EWG (iShares MSCI Germany Index Fund)
CAT (Caterpillar).
Commentary
So tantalizing.
After crossing overbought territory on Friday, T2108 has inched higher the last two days…and yet has STILL failed to close at or above the 70% threshold that marks overbought conditions.
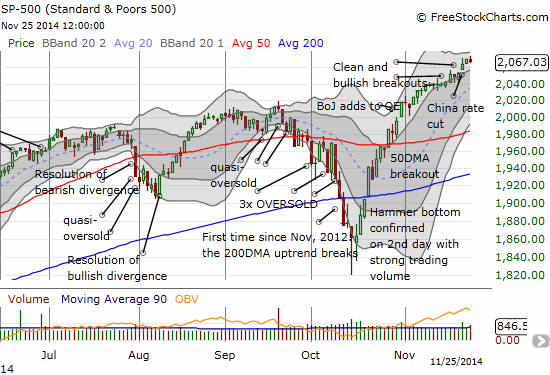
The S&P 500 (SPY) closed down marginally but overall it is maintaining a bullish bias and perspective.
As the suspense extends, volatility continues to plunge, seemingly “guaranteeing” that T2108 WILL close in overbought territory at some point soon.
I discussed the trading strategy in the last T2108 Update and repeat it here for reference:
“This milestone is “close enough” for trading purposes to initiate the overbought trading strategy. I am keeping it VERY simple.
In the coming week, if the S&P 500 closes below its low from Friday of 2056.76, I will assume some kind of top is in the market – definitely not “THE” top. I doubt I will try to chase the S&P 500 (SPY) lower with ProShares Ultra S&P500 (SSO) put options, but I will stop buying every dip with SSO call options. I will get much more comfortable shorting individual stocks at key technical levels. However, it is VERY difficult for me to get outright bearish on the market at this juncture without a breach of some major technical level, like 2000 or the 50DMA.
If the S&P 500 presses higher into overbought territory, I will assume the market is embarking on an overbought rally. In this case, I think the rally could be quite powerful given all the news recently of more stimulus from major central banks (China and the ECB). My strategy in this scenario will be to continue aggressively buying dips on SSO with call options. I will also lock in profits on select longs in individual stocks. This strategy only ends once a technical topping pattern appears (like a blow-off top) or T2108 drops out of overbought conditions.”
I mention this because ONE new wrinkle has appeared in the form of the Australian dollar (FXA) versus the Japanese yen (FXY). AUD/JPY has suddenly turned down sharply. This currency pair has been a trusty indicator all year either as a leader or a confirmation. So, I sat up VERY straight when I took a look at this chart…
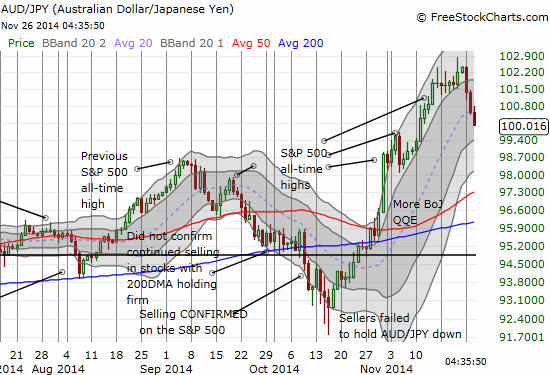
For now, I remain net long the Australian dollar and used this dip in AUD/JPY as a buying opportunity given warranted bearishness on the Japanese yen. I am prepared to greatly increase my short of AUD/USD if the Aussie continues to lose altitude.
So hold onto your seats. In the U.S., Thanksgiving is coming followed by one of the most important shopping days of the year. It is treated as a major retail and financial milestone. In the currency markets, I am guessing it is a time of low volume and a chance for tricky traders to play tricky games. Under these circumstances it is more important than ever to stay focused on the fundamental, underlying message from T2108: stay bullish until proven otherwise. In the currency markets, I translate the conviction to the trend is our friend until it ends.
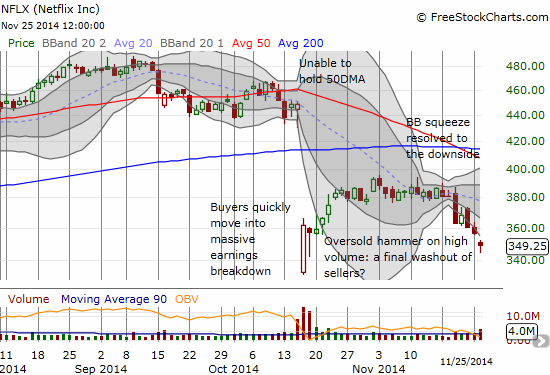
I conclude with more Netflix (NFLX) drama. Finally some palapble news! From Seeking Alpha:
“Citing the recent slowdown in the U.S. streaming sub growth (as shown by the company’s Q3 numbers), Stifel’s Scott Devitt has downgraded Netflix to Hold. Devitt: “We view risk / reward as balanced at current prices. We also view shares as more attractive in the low-$300 range until we gain more clarity on domestic subscriber growth trajectory, all else being equal.” He maintains a positive long-term stance on Netflix due to expectations for international success, but thinks U.S. growth concerns will remain a near-term overhang.
Separately, Reed Hastings stated in Mexico City yesterday Netflix’s Latin American ops now have ~5M subs (out of a global base of 53M), and aren’t yet profitable. Hastings also admitted pirated content remains a challenge for Netflix in the region.”
NFLX gapped down at the open on the heels of this news, and I kicked myself for not being positioned short. I chased the stock down with a single put option and sold it as soon as selling momentum took it into a decent profit (almost 50%). I also put in a limit order for a put spread in case NFLX would produce another fading opportunity. Much to my surprise, it triggered at a lower stock level than I expected as NFLX’s bounce just barely breached the high on the day.
This trade is perhaps the most risky of the many bearish trades I have put on NFLX since its recent top. The stock printed a hammer below its lower-Bollinger Band (BB) on high selling volume. Now that there is finally news to serve as a beacon for selling and fear, it could also serve as selling catharsis. That is, this news could (ironically enough) wring out the final sellers who waited to bail until some kind of news came out to give them a reason to get out the way. I can easily see NFLX bouncing again out of these over-extended conditions. After all, the Mexican news is relatively minor on the scale of NFLX’s business. Moreover, the analyst downgrade was more an aspirationl trading call hoping for a low 300s entry point to play a HIGHER price target at $380. As usual, stay tuned!
Daily T2108 vs the S&P 500
")
Black line: T2108 (measured on the right); Green line: S&P 500 (for comparative purposes)
Red line: T2108 Overbought (70%); Blue line: T2108 Oversold (20%)
Weekly T2108

*All charts created using freestockcharts.com unless otherwise stated
The T2108 Resource Page
Expanded daily chart of T2108 versus the S&P 500
Expanded weekly chart of T2108
Be careful out there!
Full disclosure: long SSO shares, long NFLX put spread