(This is an excerpt from an article I originally published on Seeking Alpha on August 28, 2014. Click here to read the entire piece.)
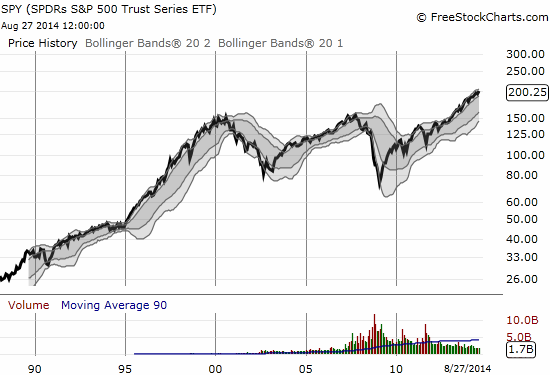
The S&P 500 (SPY) has been one stubborn index. Despite so many possible catalysts to deliver for the bears, the index has bounced back from every concern. This is of course what it means to trade at all-time highs.
I can understand the angst because THIS was supposed to be the year of a 10% correction, long overdue following an incredible 2013. {snip}
One piece I noticed that made rounds related to the supposed remarkable “speed” of the current gains came from the Wall Street Journal’s MoneyBeat. In an article amply titled “A Timeline of S&P 500 Milestones,” the WSJ noted:
{snip}
I have become accustomed to people talking about points on the Dow Jones Industrial Average (DIA) without considering percentage moves, but this piece was one of those rare moments the S&P 500 was made to suffer for points over percentages. It turns out that the recent move is not unusual at all when observed with the proper lens of percentages…even after greatly shortening the timeframe for the recent gains.
The bulk of the S&P 500’s 100-point gain since the first finish above 1900 in May has come in just 13 trading days. On August 7, 2014, the S&P 500 closed at 1909.57. On August 26, 2014, the index closed at 2002.02. Over the 13 trading-day rally, the S&P 500 gained 92.45 points for a 4.7% gain. Since 1950 and through August 1, 2014, there have been a total of 1,148 trading days where the 13-day gain was at least 4.7%. This is out of a total 16,237 trading days – a non-trivial 7.1% of the time. The highest 13-day gains occurred in 2008 and 2009 with gains ranging from 18.1% to 23.1%. There have been 79 trading days with double-digit 13-day gains.
{snip}

Source: FreeStockCharts.com
Be careful out there!
Full disclosure: no positions
(This is an excerpt from an article I originally published on Seeking Alpha on August 28, 2014. Click here to read the entire piece.)
