
(T2108 measures the percentage of stocks trading above their respective 40-day moving averages [DMAs]. It helps to identify extremes in market sentiment that are likely to reverse. To learn more about it, see my T2108 Resource Page. You can follow real-time T2108 commentary on twitter using the #T2108 hashtag. T2108-related trades and other trades are sometimes posted on twitter using the #120trade hashtag. T2107 measures the percentage of stocks trading above their respective 200DMAs)
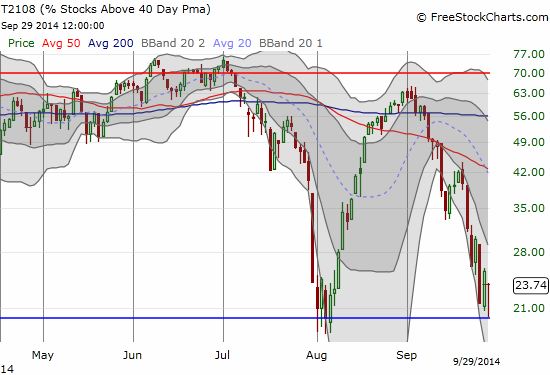
T2108 Status: 23.7%
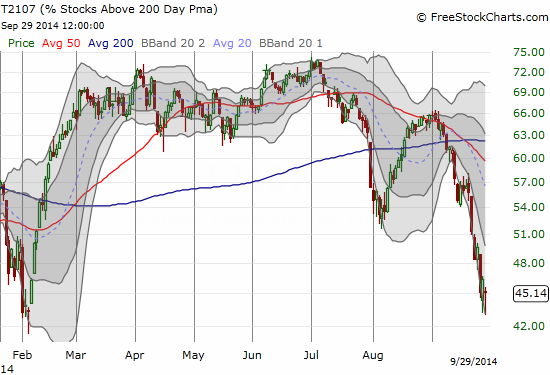
T2107 Status: 45.1% (exactly matches 7 1/2 month closing low set on Friday)
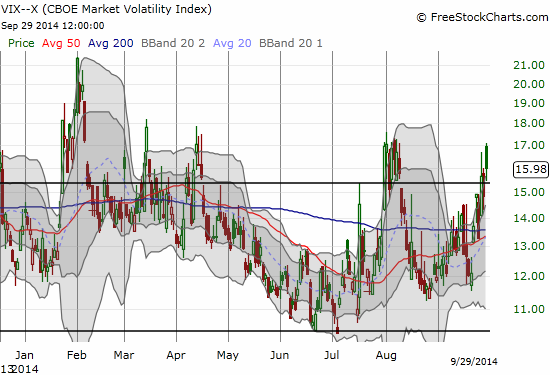
VIX Status: 15.98
General (Short-term) Trading Call: Hold (TRADERS REMAIN READY FOR WIDE SWINGS)
Active T2108 periods: Day #318 over 20% (includes day #280 at 20.03%, day #318 low at 20.25%), Day #5 under 30% (underperiod), Day #11 under 40%, Day #13 under 50%, Day #15 under 60%, Day #57 under 70%
Reference Charts (click for view of last 6 months from Stockcharts.com):
S&P 500 or SPY
SDS (ProShares UltraShort S&P500)
U.S. Dollar Index (volatility index)
EEM (iShares MSCI Emerging Markets)
VIX (volatility index)
VXX (iPath S&P 500 VIX Short-Term Futures ETN)
EWG (iShares MSCI Germany Index Fund)
CAT (Caterpillar).
Commentary
So today delivered the gap down I was looking for on Friday. Still, T2108 did not quite reach oversold territory. It got as low as a tantalizing 20.03%.
T2107 also dipped. Unlike T2108, its intraday recovery only took it back to last Thursday’s close.
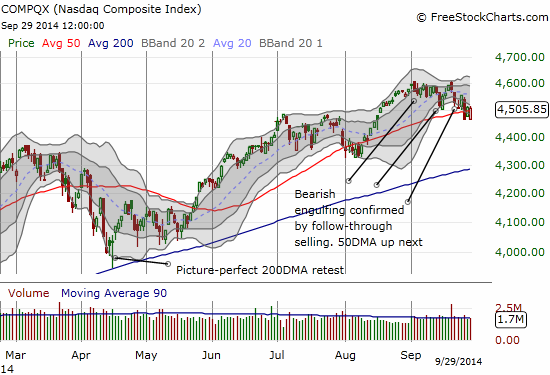
The question now of course is whether this drop was “close enough” to triggering oversold conditions. The move off the bottom was too quick for me to react intraday. Moreover, I prefer a CLOSE in oversold conditions before lining up my trades on oversold conditions. To add to my hesitancy, the major indices, the S&P 500 (SPY) and the NASDAQ (QQQ), are struggling at their 50-day moving averages (DMAs).
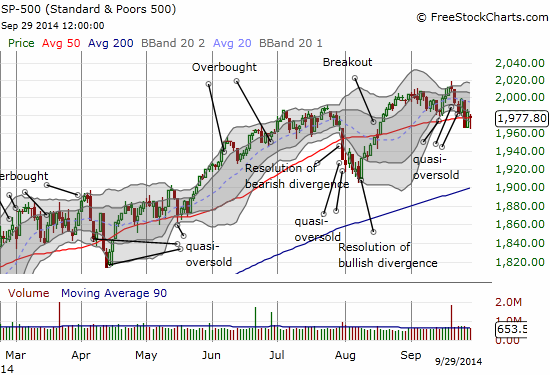
Note that the S&P 500 does not show the proper open. SPY shows the gap down.
Finally, on the positive side, the VIX, the volatility index, gapped up and then failed to beat the high from August 1st that marked the peak of the last sell-off.
So, on balance, the trading call remains on HOLD yet again. IF the indices manage a solid close above the 50DMA -meaning a close above Thursday’s high as well – I will feel comfortable assuming that oversold conditions are behind us. Ironically, I will feel even MORE comfortable initiating buys if the S&P 500 generates some more palpable fear with a large spike in the VIX, a T2108 below 18% (the low from the last sell-off), and even an S&P 500 that cracks September’s low. Stay tuned!
Daily T2108 vs the S&P 500
")
Black line: T2108 (measured on the right); Green line: S&P 500 (for comparative purposes)
Red line: T2108 Overbought (70%); Blue line: T2108 Oversold (20%)
Weekly T2108

*All charts created using freestockcharts.com unless otherwise stated
The T2108 Resource Page
Expanded daily chart of T2108 versus the S&P 500
Expanded weekly chart of T2108
Be careful out there!
Full disclosure: net short the Australian dollar