(T2108 measures the percentage of stocks trading above their respective 40-day moving averages [DMAs]. It helps to identify extremes in market sentiment that are likely to reverse. To learn more about it, see my T2108 Resource Page. You can follow real-time T2108 commentary on twitter using the #T2108 hashtag. T2108-related trades and other trades are posted on twitter using the #120trade hashtag)
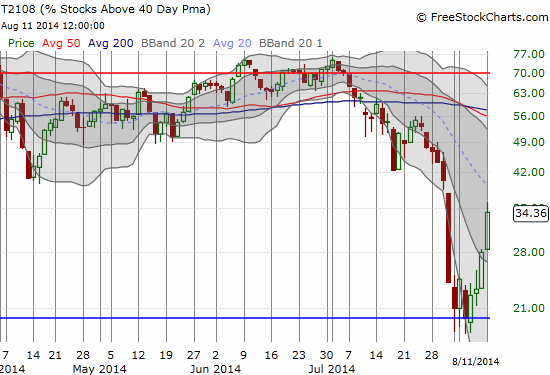
T2108 Status: 34.4%
VIX Status: 14.2%
General (Short-term) Trading Call: Selective buying for short-term trades. Fade rallies ONLY at or near resistance. Nuances explained in the recent T2108 Updates.
Active T2108 periods: Day #284 over 20% (includes day #280 at 20.01%), Day #8 under 30% and 40% (underperiods), Day #12 under 50%, Day #23 under 60%, Day #24 under 70%
Reference Charts (click for view of last 6 months from Stockcharts.com):
S&P 500 or SPY
SDS (ProShares UltraShort S&P500)
U.S. Dollar Index (volatility index)
EEM (iShares MSCI Emerging Markets)
VIX (volatility index)
VXX (iPath S&P 500 VIX Short-Term Futures ETN)
EWG (iShares MSCI Germany Index Fund)
CAT (Caterpillar).
Commentary
My eyes are open wide after reviewing today’s closing metrics. T2108 put on a spectacular show surging from 28% to 34% that seems to confirm last week’s bullish divergence. I even have just one minor caveat for today.
The only caveat this time around is that the S&P 500 had a weak close. The index finished with a fade from its highs even as it broke above the current downtrend channel. Still, the S&P 500 seems all-clear for a test of the 50DMA as resistance. This is the spot where I will next give the bearish case a re-consideration. At T2108’s current pace, it is VERY possible my favorite indicator will actually approach overbought levels on such a retest (a perfect combination).
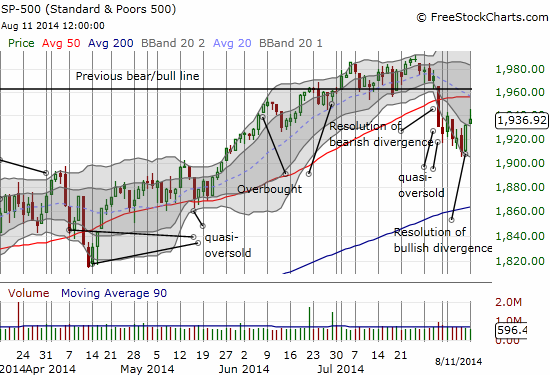
The path looks all clear for a 50DMA retest on the S&P 500 for several reasons. First of all, the NASDAQ has now CLEARED the hurdle over its 50DMA. Assuming this is a bullish breakout, a NASDAQ rising should help drag the S&P 500 higher…even if it is slow and grinding.

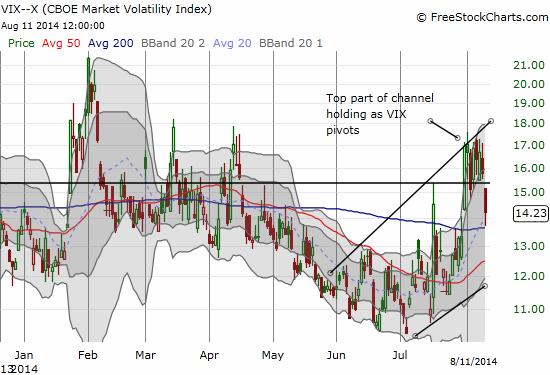
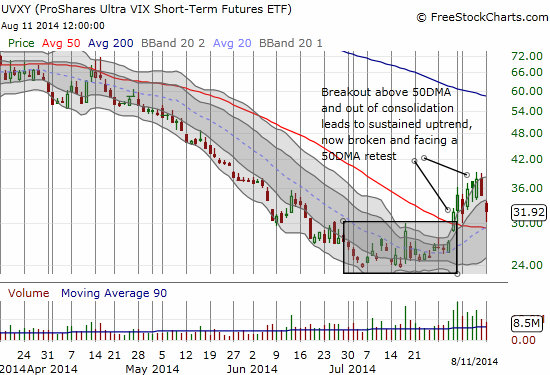
The VIX gapped down neatly below the 15.35 pivot point. Even though it is hovering over its 200DMA, I have no reason to believe from recent history that the 200DMA is a meaningful indicator for the VIX. Instead, the 50DMA and the bottom of the current trading channel for the VIX should be much more important. I am assuming that a VIX heading into those lows will accompany a higher S&P 500. A side-effect of the VIX’s 10% plunge is the end of the primary uptrend for ProShares Ultra VIX Short-Term Futures (UVXY). I bought a second small tranche of shares “just in case” I am flat out wrong about a 50DMA retest for the S&P 500. Otherwise, I am well-positioned with UVXY puts. It is still going to be a close call with my ProShares Ultra S&P500 (SSO) call options expiring this Friday.
In a surprising development, Marc Faber, one of the more famous permabears around, proclaimed on CNBC today that the market has recovered from a “fully oversold condition.” Interested in what indicator Faber uses, I watched the short video clip and read the accompanying article. Lo and behold, he used an indicator similar to T2108: the percentage of stocks trading above their 50-day moving average, available as $NYA50R in stockcharts.com.
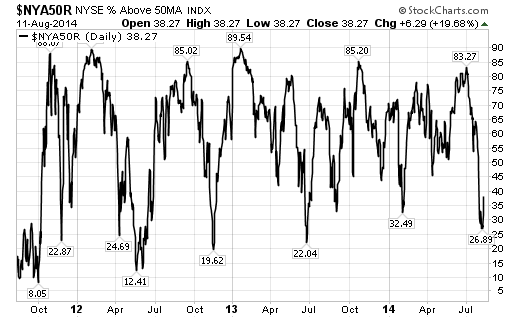
Source: StockCharts.com
Stockcharts.com has a series of 50DMA indicators for the major indices. I have always wanted to transfer my analysis of T2108 to a 50DMA version, but Stockcharts.com does not allow data downloads and only shows historical data 3 years at a time (without a subscription). Once Worden2000 went free through FreeStockCharts.com, it made complete sense to stick with T2108.
Faber went on to make an assessment that fully agrees with the one I made when the S&P 500 sliced through the last bear/bull line and the 50DMA on the same day with a 2% loss (emphasis mine):
“…Now a rebound is underway in my opinion. But I doubt we will make new highs, and if we make new highs, maybe just with the very limited number of shares, because the technical damage is quite significant…”
Note well that Faber, probably unlike most committed bears, is contemplating the possibility of the market making new highs. He is describing a situation where the market makes marginal new highs with, say T2108, failing to keep pace, perhaps even declining. Stay tuned on that one. First let’s see what happens on a 50DMA retest for the S&P 500.
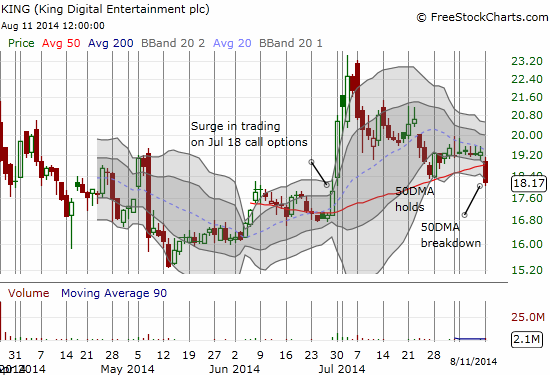
Finally, I conclude with an update on King Digital Entertainment (KING). I explained the trade on June 30th. At the time I concluded with the following:
“I am currently holding a single tranche of shares that I bought on the first day of trading that are now finally even. I bought a second tranche at a much better price (using patience that was more appropriate for the extreme skepticism thrown at KING) and sold that for a nice profit on a nice pop two days later. The options trade has thrown my core hold strategy for a loop because it produces a good possibility that the stock could burn out buyers in the next two weeks. I wanted to hold through earnings as I think the market will get positively surprised by the results: KING will remind the market that it is actually a profitable company with a healthy business. Stay tuned on this one.”
Sure enough, buyers are burning out ahead of earnings. I would try another shot here given the market’s bullish tone, but I am too leery of the 50DMA breakdown and persistent pre-earnings weakness. KING reports earnings after market on Tuesday, August 12th. I will be “on watch.” Short interest has continued to climb with shorts in KING at 19.7% of float, about 10% higher since I wrote about KING.
Daily T2108 vs the S&P 500

Black line: T2108 (measured on the right); Green line: S&P 500 (for comparative purposes)
Red line: T2108 Overbought (70%); Blue line: T2108 Oversold (20%)
Weekly T2108

*All charts created using freestockcharts.com unless otherwise stated
Related links:
The T2108 Resource Page
Expanded daily chart of T2108 versus the S&P 500
Expanded weekly chart of T2108
Be careful out there!
Full disclosure: long UVXY shares and puts, long SSO call options

I don’t know if it’s just me or if perhaps everyone else encountering issues with
your blog. It looks like some of the text within your posts are running off the screen. Can somebody else please provide feedback and
let me know if this is happening to them too?
This could be a issue with my internet browser because I’ve had this happen previously.
Thank you
I don’t see the issue. Let me know what browser you are using and the version (always update your browser!) and I can check with the web hosting service.