
(T2108 measures the percentage of stocks trading above their respective 40-day moving averages [DMAs]. It helps to identify extremes in market sentiment that are likely to reverse. To learn more about it, see my T2108 Resource Page. You can follow real-time T2108 commentary on twitter using the #T2108 hashtag. T2108-related trades and other trades are posted on twitter using the #120trade hashtag)
T2108 Status: 57.4%
VIX Status: 13.4
General (Short-term) Trading Call: Short (fade rallies).
Active T2108 periods: Day #206 over 20%, Day #58 over 40% (over-period), Day #10 over 50% (over-period), Day #14 under 60% (under-period), Day #18 under 70%
Reference Charts (click for view of last 6 months from Stockcharts.com):
S&P 500 or SPY
SDS (ProShares UltraShort S&P500)
U.S. Dollar Index (volatility index)
EEM (iShares MSCI Emerging Markets)
VIX (volatility index)
VXX (iPath S&P 500 VIX Short-Term Futures ETN)
EWG (iShares MSCI Germany Index Fund)
CAT (Caterpillar).
Commentary
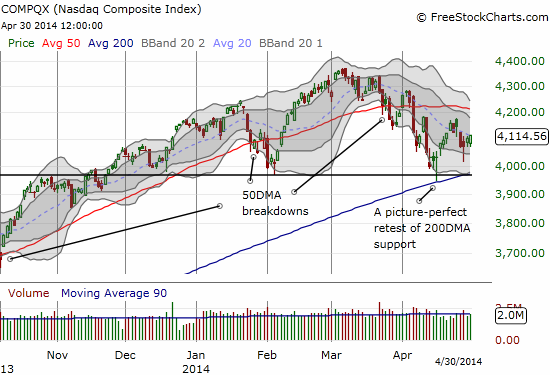
I last wrote a T2108 Update ten trading days ago. At that time, the NASDAQ (QQQ) had just completed a picture-perfect bounce off its 200-day moving average (DMA) that I wondered aloud may have been “too perfect.” After some thrills and spills that support remains well intact. A lot has happened in that short time with earnings rolling out; I will point out just a few top highlights with implications for current trading.
T2108 closed at 57.4% to end April’s trading. The prior week, T2108 printed a quasi-oversold reading on April 25th that set up the current bounce. T2108 dropped 12.0% in 2-days so the move was minor and would not have warranted a bullish trading call from me. However, with the S&P 500 (SPY) now three-days off a 50DMA bounce, that quasi-oversold day is starting to look more significant. The standard trading rule is to give relief bounces three trading days: May begins with a “fade the rally” trading call as the S&P 500 closed right below the intra-day highs from the previous week. A classic “beginning of the month” rally would form a minor breakout with an even juicier level for fresh shorts. The index is inching against gravity here. It refuses to give a solid confirmation of my now 6-week trading call that the market has printed some kind of lasting top.
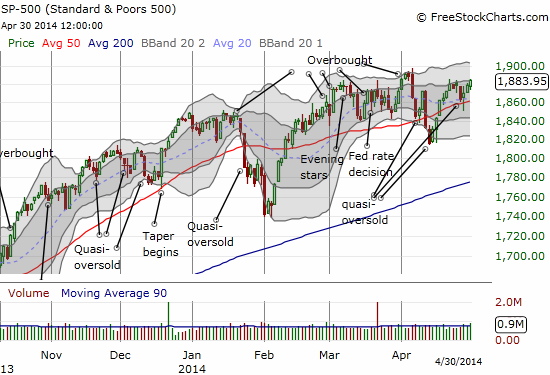
As I have stated in earlier posts, I have focused more of my fade-the-rally moves against the NASDAQ as momentum and high-flying stocks have suffered the brunt of the recent selling pressure. The NASDAQ is in poorer shape than the S&P 500, as it also nobly fights against gravity with 200DMA support holding. A fade here is not quite as clear as the S&P 500 given the NASDAQ closed April’s in the middle of more churn and not in the middle of a real relief rally. Note below that the index does sit at a declining 20DMA.
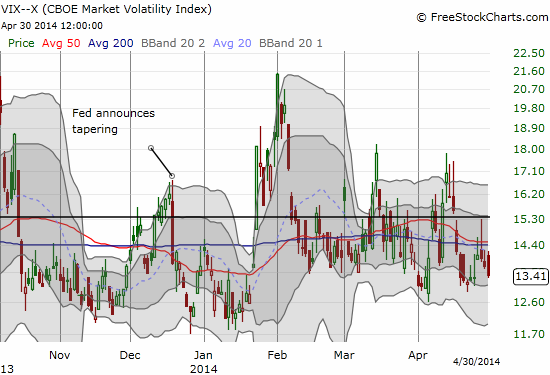
Our good friend the VIX, the volatility index, is supporting the bullish case as it continues to struggle to stay above the critical 15.35 pivot point. Monday gave the bulls a nice buying signal by fading off that pivot point in combination with the mild quasi-oversold reading. While the S&P 500 is fade-able, more conservative traders could also wait to see whether they can wait for the VIX to retest recent lows before making a move.
I hope to have time in the next few days to do a comprehensive set of chart reviews. For now, I am highlighting three charts: Netflix (NFLX), Apple (AAPL), and Intuitive Surgical (ISRG). In coming days, I also hope to write about the pre/post earnings reports on each stock.
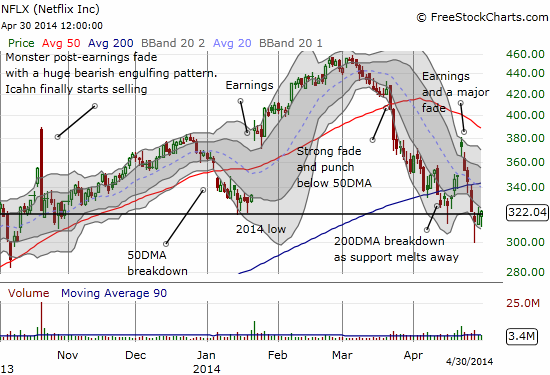
NFLX was a huge disappointment. I nailed the pre-earnings bullish trading call but failed to profit as I made the fateful decision to hold my position after the nice 7.0% post-earnings pop. Call it greed, call it a failure to think faster on my feet – either way I consider it a major fail! On Monday, NFLX punched through for a new low on the year, a very dramatic turn-around fade of the post-earnings move. The stock now sits right at the former 2014 low. It is very possible sellers have finally exhausted themselves. Until I examine more closely what happened to the stock these past several days, I am not making a definitive trading call here. Notice in the chart below how the previous 2014 intra-day low magically corresponds to the post-earnings low from the last major NFLX post-earnigs fade (in October); NFLX rose back from the ashes nicely after that one!
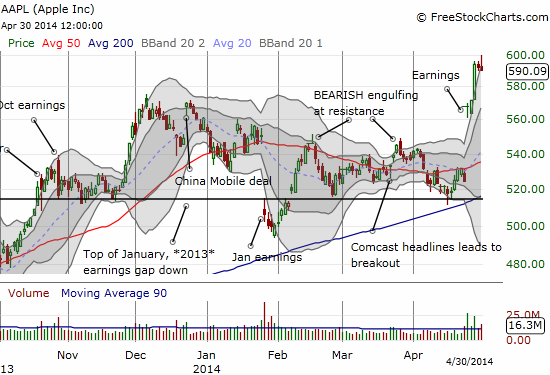
I am of course really sorry I missed the April pre-earnings trade on AAPL. Missing earnings was particularly noteworthy since I pointed to April earnings as a likely major turning point for AAPL’s stock. I am even MORE sorry I was unable to make a play for a typical Monday rally for AAPL! I think a trade there would have been one of the biggest wins for the Apple Trading Model (ATM) to-date!
I think the chart speaks for itself. Note that AAPL may have topped out for now with the ominous fade from $600 occurring well-above the upper-Bollinger Band. AAPL spent an impressive four trading days over-stretched. A quick review of past AAPL charts should quickly remind traders that these moves well above the upper-BB typically end in tears. All that remains is follow-through selling to confirm (the ATM should ring selling bells for Thursday and Friday trading – sorry I ran out of time to refresh it for today). It is very possible I will finally sell my few shares here. I am in a bit of a race against time on this one as I want to study the situation more deeply before making a move.
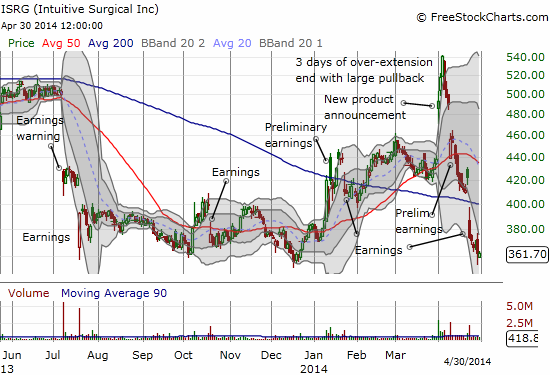
Finally, ISRG is one of the biggest disappointments in April for me. I have not made a trade in a while, but I was hopeful that the stock and the company had finally turned the bearish tide after it started April with a very bullish response to a new product announcement. Since then, earnings-related news has pounded the stock all the way back toward 52-week lows. With a post-earnings response that featured a gap down below the 200DMA, the stock is suddenly in a very precarious position. This is a classic case where I want to stay bullish, but the stock is screaming at me to reconsider….
Daily T2108 vs the S&P 500
")
Black line: T2108 (measured on the right); Green line: S&P 500 (for comparative purposes)
Red line: T2108 Overbought (70%); Blue line: T2108 Oversold (20%)
Weekly T2108

*All charts created using freestockcharts.com unless otherwise stated
Related links:
The T2108 Resource Page
Expanded daily chart of T2108 versus the S&P 500
Expanded weekly chart of T2108
Be careful out there!
Full disclosure: long SSO puts, long QQQ puts, long NFLX call spread, long AAPL shares