
(T2108 measures the percentage of stocks trading above their respective 40-day moving averages [DMAs]. It helps to identify extremes in market sentiment that are likely to reverse. To learn more about it, see my T2108 Resource Page. You can follow real-time T2108 commentary on twitter using the #T2108 hashtag. T2108-related trades and other trades are posted on twitter using the #120trade hashtag)
T2108 Status: 45.8%
VIX Status: 15.6
General (Short-term) Trading Call: Short (fade rallies). See caveats below.
Active T2108 periods: Day #196 over 20%, Day #48 over 40% (over-period), Day #4 under 50% (under-period), Day #4 under 60%, Day #8 under 70%
Reference Charts (click for view of last 6 months from Stockcharts.com):
S&P 500 or SPY
SDS (ProShares UltraShort S&P500)
U.S. Dollar Index (volatility index)
EEM (iShares MSCI Emerging Markets)
VIX (volatility index)
VXX (iPath S&P 500 VIX Short-Term Futures ETN)
EWG (iShares MSCI Germany Index Fund)
CAT (Caterpillar).
Commentary
You could not make this stuff up even if I tried…and I am guessing I will look back on April 15th, a day affectionately known as “tax day” in the U.S., as a pivotal trading day.
The morning looked awful as sellers quickly reversed the sharp pop that ended Monday’s trading and delivered the predicted oversold bounce. As has become standard fare, the NASDAQ (QQQ) and its high-tech, high-flying, highly valued kin were some of the hardest hit by the selling. By the low of the day, the NASDAQ could see the whites of the eyes on the 200-day moving average (DMA). At that point, almost like magic, the buying kicked in.

The NASDAQ last touched its 200DMA around the start of 2013. That duration is a testimon to the strength of the rally. My main regret is that I could not be present to take a stab at playing such a momentous occasion.
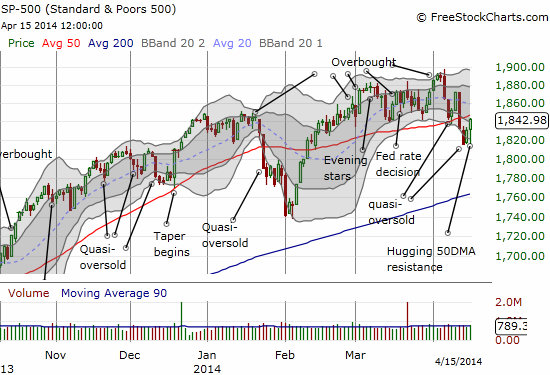
This bounce looks almost too perfect, but it matches well with a massive busting of stops at the intraday lows for the year (see the black, thick horizontal line). Assuming stops were taken out, a bunch of reluctant sellers may have just paved the way for a bunch of buyers eager to jump into the breach.
Of course the buying helped the S&P 500 (SPY) as well. The index surged right into its 50DMA resistance before trading closed for the day. Net-net, if it were not for that ominous 50DMA, the S&P 500 would still look barely phased by the current selling. Compare and contrast: the NASDAQ has a noticeable “sag” from its recent 11-year or so high, creating a short-term downtrend. The S&P 500 on the other hand has barely budged from the land of “churn” off its recent all-time highs.
With T2108 coming off the 40% level and starting to form what looks like a series of higher lows, it is time to take the foot off the pedal on bearishness. The sell-off has left a lot of overhead room for a fresh wave of buyers who want to snap up “bargains.” Accordingly, I am not adding to the small number of QQQ puts I bought Monday to fade the oversold bounce. (I sold my EEM puts into today’s selling). I will ride my recent nibbles on some momentum names. I will not look to fade again until the NASDAQ hits its now sharply downtrending 20DMA and/or the S&P 500 challenges all-time highs again.
Finally, the VIX is showing signs it is topping out again. While it remains above the 15.35 pivot, it looks like it is running out of gas for this cycle. I am clinging tightly to my UVXY puts…

Daily T2108 vs the S&P 500
")
Black line: T2108 (measured on the right); Green line: S&P 500 (for comparative purposes)
Red line: T2108 Overbought (70%); Blue line: T2108 Oversold (20%)
Weekly T2108

*All charts created using freestockcharts.com unless otherwise stated
Related links:
The T2108 Resource Page
Expanded daily chart of T2108 versus the S&P 500
Expanded weekly chart of T2108
Be careful out there!
Full disclosure: long SSO puts, long QQQ puts, long QID calls, long UVXY puts