(T2108 measures the percentage of stocks trading above their respective 40-day moving averages [DMAs]. It helps to identify extremes in market sentiment that are likely to reverse. To learn more about it, see my T2108 Resource Page. You can follow real-time T2108 commentary on twitter using the #T2108 hashtag. T2108-related trades and other trades are posted on twitter using the #120trade hashtag)
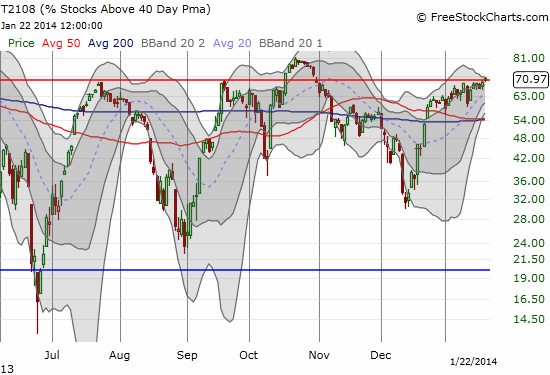
T2108 Status: 71.0%
VIX Status: 12.8
General (Short-term) Trading Call: Short (bearish bias).
Active T2108 periods: Day #138 over 20%, Day #1 over 70% (overbought)
Reference Charts (click for view of last 6 months from Stockcharts.com):
S&P 500 or SPY
SDS (ProShares UltraShort S&P500)
U.S. Dollar Index (volatility index)
EEM (iShares MSCI Emerging Markets)
VIX (volatility index)
VXX (iPath S&P 500 VIX Short-Term Futures ETN)
EWG (iShares MSCI Germany Index Fund)
CAT (Caterpillar).
Commentary
T2108 avoided overbought status for 52 straight trading days until peeking over the requisite 70% threshold today.

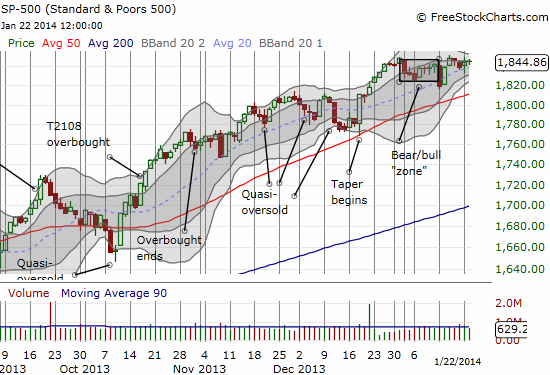
I thought hitting this point would bring resolution to an important juncture, but the tease just barely continues. The S&P 500 barely advanced on the day and remains stuck right near the top of the “bear/bull” zone that I defined earlier.

The S&P 500 (SPY) enters this overbought period after printing a very high performance for the 70% underperiod. I would like to think this means performance from the overbought period has been “pulled forward,” especially with earnings season in full throttle now. Instead, I think the better perspective recognizes that once/if the S&P 500 follows through in this overbought period, the index could take off for another legendary extended overbought rally. For now, I am maintaining the bearish bias UNTIL the follow-through occurs. After that, I will follow the standard overbought strategy: bullish first, bearish with a return to the 70% underperiod and/or bearish on appropriate technicals before overbought day #20.
I end with two earnings-related chart reviews.
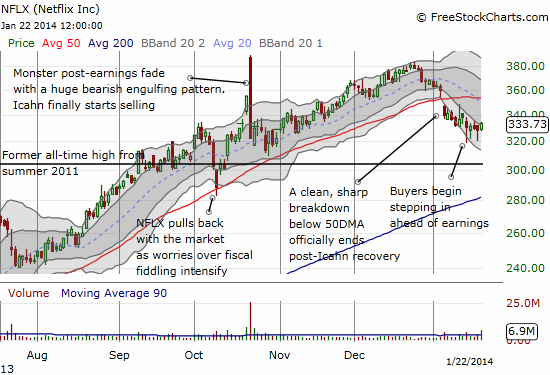
First up, Netflix (NFLX). The stock traded up an incredible 18% or 60 points in after-hours after the company reported earnings. This puts the stock at a fresh all-time high. While Carl Icahn will likely use this fresh gift to once again sell shares into the increased liquidity generated by post-earnings reactions, I do NOT think it is as clear a shorting opportunity as the last post-earnings response. Last time, NFLX soared almost 12% above its upper-Bollinger Band (BB). That move is about as over-extended as they come! This time, NFLX will be trading just above the upper-BB. Do not be surprised to see additional momentum before the stock pulls back for a rest. With Icahn overhang out of the way, it is very possible upward momentum will continue.
I last charted NFLX two weeks ago when it broke below its 50DMA. The stock barely followed through on the selling; three times in the last five trading days, buyers rushed in and picked NFLX off the bottom. I guess I should have taken those moves as a bullish pre-earnings sign! I will now be alert for applying this template in other pre-earnings scenarios featuring a stock that should be selling off.

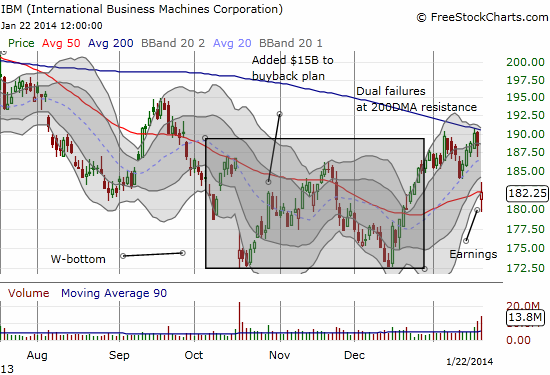
Lastly, International Business Machines (IBM). IBM is turning into a good trading stock. Two months ago I wrote “Simple Reasons to Like IBM Despite the Headwinds” and have written a few chart reviews since then. I had a modicum of success buying dips but over-extended myself buying a call spread ahead of earnings. That over-confidence has cost me a worthless position but a valuable (re)lesson. There was no real dip to buy here. In fact, IBM had just failed at the 200DMA for the second time this month, triggering what should have been a bright red technical flag to short the stock. The post-earnings trading reaction is indicative of a stock that still has dip-buyers. The stock over-extended a bit below the lower-BB and bounced right into natural resistance/support at the 50DMA. It is all about the follow-through from here. I will not go long again until a strong close above the 50DMA. Otherwise, the recent W-bottom is likely to get retested relatively quickly.

Daily T2108 vs the S&P 500

Black line: T2108 (measured on the right); Green line: S&P 500 (for comparative purposes)
Red line: T2108 Overbought (70%); Blue line: T2108 Oversold (20%)
Weekly T2108

*All charts created using freestockcharts.com unless otherwise stated
Related links:
The T2108 Resource Page
Expanded daily chart of T2108 versus the S&P 500
Expanded weekly chart of T2108
Be careful out there!
Full disclosure: long SPHB and SPLV and SSO puts (pairs trade)
