
(T2108 measures the percentage of stocks trading above their respective 40-day moving averages [DMAs]. It helps to identify extremes in market sentiment that are likely to reverse. To learn more about it, see my T2108 Resource Page. You can follow real-time T2108 commentary on twitter using the #T2108 hashtag. T2108-related trades and other trades are posted on twitter using the #120trade hashtag)
T2108 Status: 56.7%
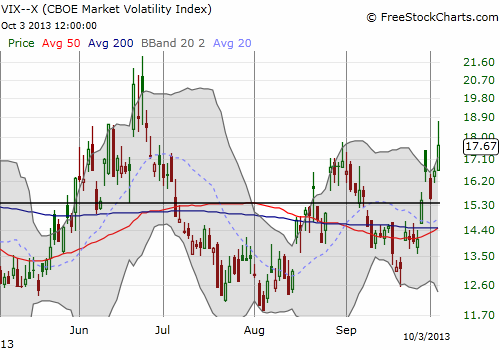
VIX Status: 17.7 (up 6.5%)
General (Short-term) Trading Call: Hold. Aggressive traders can short on S&P 500 follow-through below 50DMA
Active T2108 periods: Day #68 over 20% (overperiod), Day #1 under 60%, Day #93 under 70%
Reference Charts (click for view of last 6 months from Stockcharts.com):
S&P 500 or SPY
SDS (ProShares UltraShort S&P500)
U.S. Dollar Index (volatility index)
EEM (iShares MSCI Emerging Markets)
VIX (volatility index)
VXX (iPath S&P 500 VIX Short-Term Futures ETN)
EWG (iShares MSCI Germany Index Fund)
CAT (Caterpillar)
Commentary
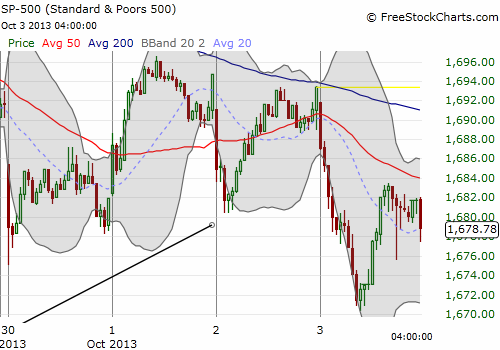
Today’s trading was essentially the reverse of the burst that started the month. The S&P 500 lost 0.90%, closing just under the 50DMA after a mid-day rally stopped short.
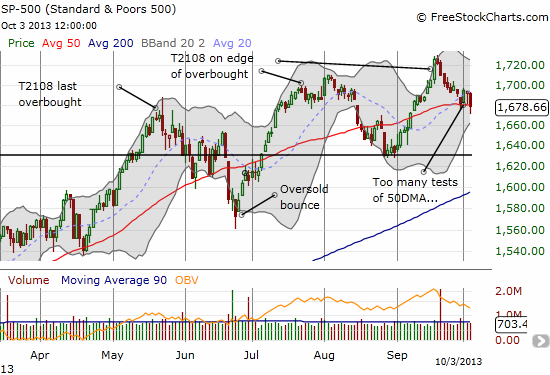
Early in the day, I tweeted the following: “#SP500 retesting 50DMA. Can it pull off beast mode yet again and defy gravity? #T2108 intraday plunge says no. $SPY”. This proved to be correct. I was referencing T2108’s mild behavior over the past 2 weeks or so while the S&P 500 (SPY) cascaded downward into the current test of the 50DMA. That bullish divergence indicated to me that the market wanted to go up, government shutdown or not. Now, with these series of 50DMA tests, it seems market sentiment is turning.
If I had referenced the volatility index, the VIX, I might have come to that same conclusion. The VIX surged to its highest close since the late June sell-off. Suddenly, it seems the bears (sellers) are regaining momentum.
In the last T2108 Update, I posted a chart examining the S&P 500’s performance in October. I am reposting that chart below with a highlight on 2000-2012 to show the recent trend. Notice three main things: 1) October has actually tended to trade positively after the first day of the month no matter what happened, 2) the range of performance for the rest of the month has tightened considerably compared to the pre-2000 period, and 3) the first day of the month has essentially been just as likely to finish up as down. The overall implication remains that any big dip in October should be bought for at least a short-term trade (I am hoping it coincides with an oversold reading).
Click image for a larger view…
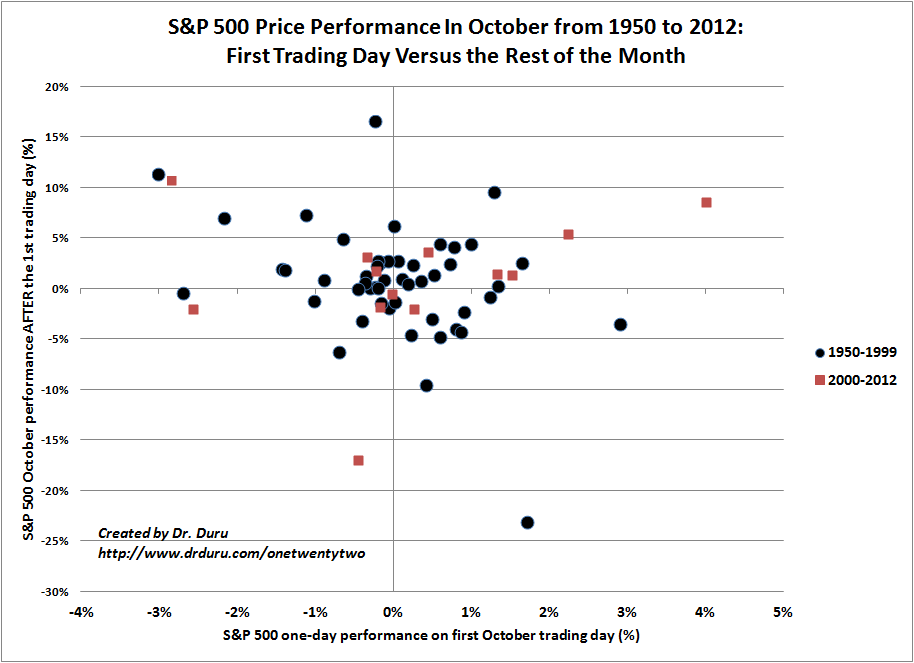
First Trading Day Versus the Rest of the Month
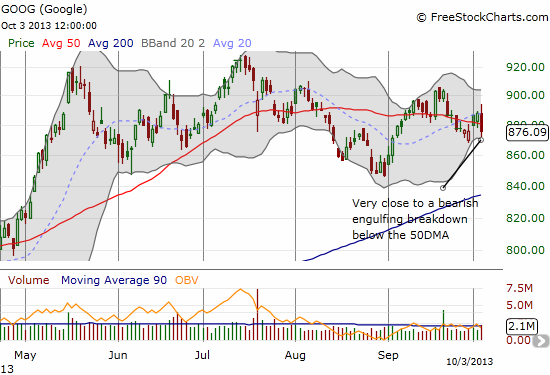
I conclude with a chart of Google (GOOG). This is a stock that cannot decide whether to breakdown or breakout…and in the process driving me nuts. I have been testing out a trading model for GOOG that has had mixed results mainly because the stock makes sudden intraday reversals. For example, it correctly predicted a down day on Monday. However, buyers stepped into the gap and sent GOOG surging to a near flat close. I barely had time to react. The model now suggests a 64% chance of a down day for Friday using just 2013 data (33% classification error). Using data from 2011 and 2012 both given even higher odds of a down day with lower classification errors. If GOOG manages to trade down again, a true breakdown may be underway.
Daily T2108 vs the S&P 500
")
Black line: T2108 (measured on the right); Green line: S&P 500 (for comparative purposes)
Red line: T2108 Overbought (70%); Blue line: T2108 Oversold (20%)
Weekly T2108

*All charts created using freestockcharts.com unless otherwise stated
Related links:
The T2108 Resource Page
Expanded daily chart of T2108 versus the S&P 500
Expanded weekly chart of T2108
Be careful out there!
Full disclosure: long VXX, long GOOG put