
(This is an excerpt from an article I originally published on Seeking Alpha on July 2, 2013. Click here to read the entire piece.)
Starting November, 2012, Japan’s longstanding efforts to devalue its currency finally began experiencing sustained success. Since the massive devaluation process started, both the Nikkei (EWJ) (NKY) AND the S&P 500 (SPY) have experienced large gains. {snip}
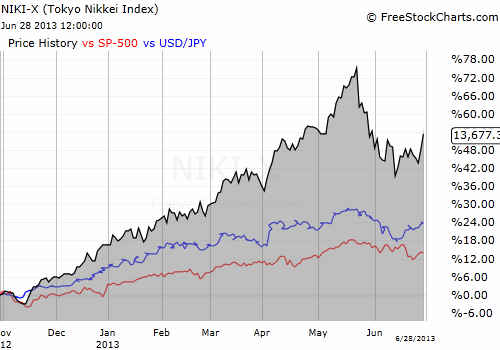
Source: FreeStockCharts.com
{snip}
At the time of typing, USD/JPY is challenging the psychological 100 level again despite what I think are a lot of assumptions that the yen’s weakness had finally come to an end. {snip}
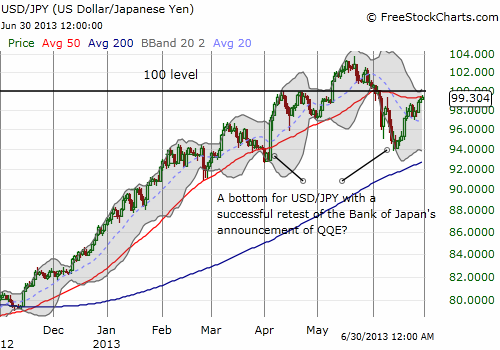
Source: FreeStockCharts.com
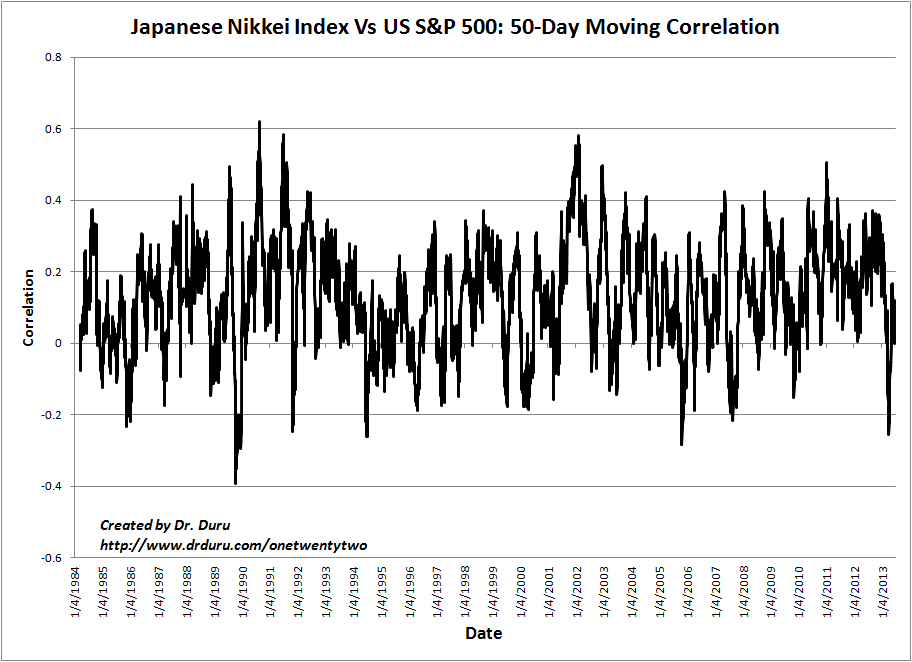
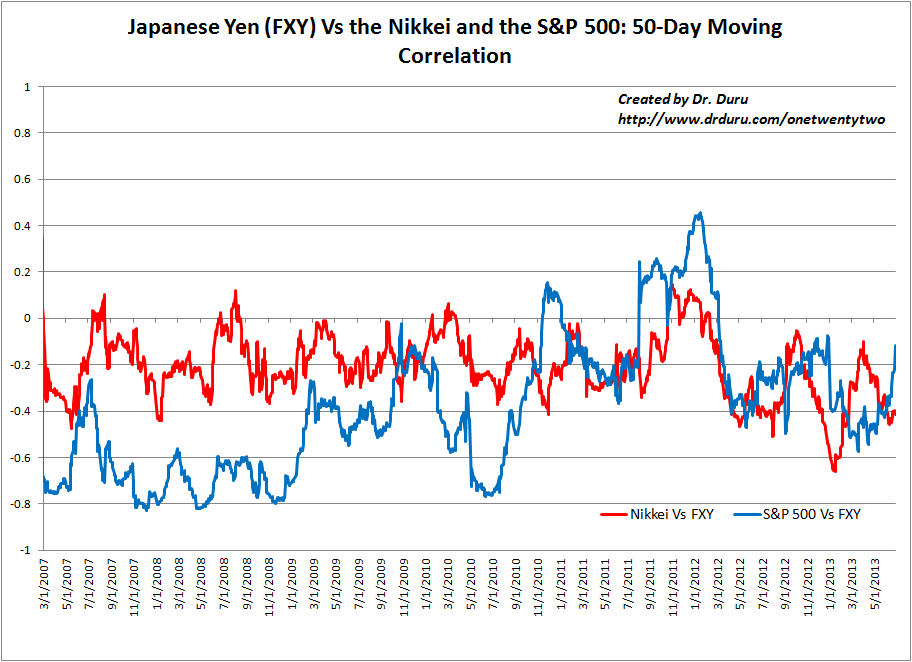
The recent break in overall correlations motivated me to look one layer deeper at the relationships amongst the yen, the S&P 500, and the Nikkei. As it turns out, the day-to-day correlations are relatively weak, BUT the directional biases are relatively consistent with the visual in the first chart above. In other words, while day-to-day there is little correlation amongst these three, they are tending to trend together.
{snip}
Click for larger graphic…
{snip}
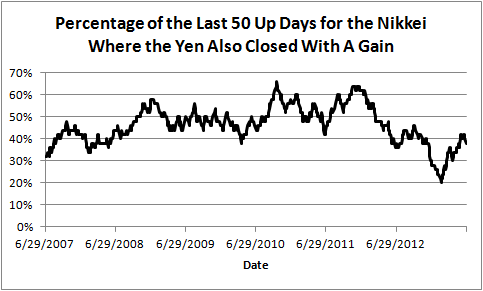
Click for larger graphic…
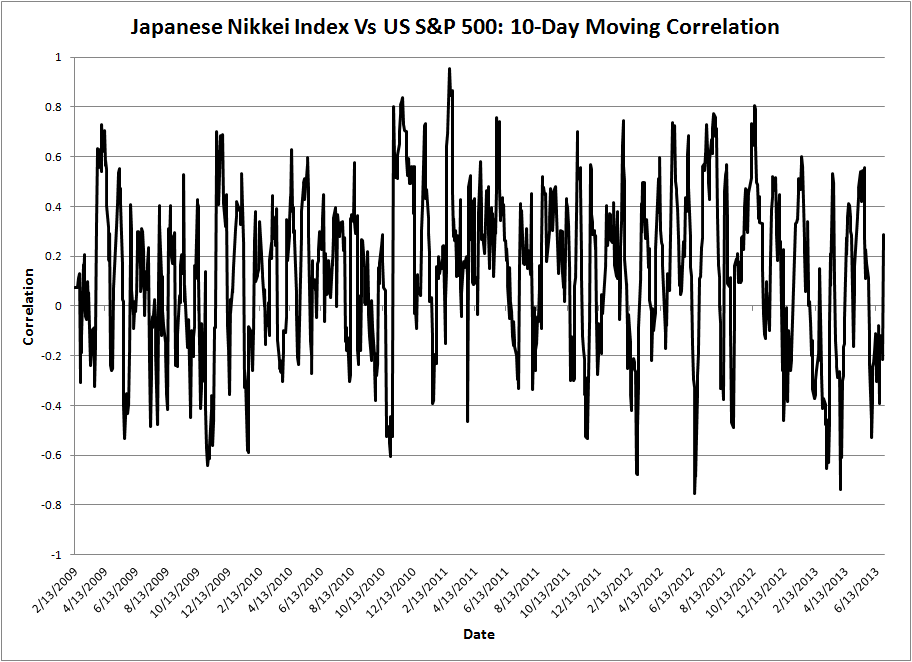
So, what the eyes see is a general tendency to trend together but NOT to trade together. {snip}
Click for larger graphic…
{snip}

{snip}
{snip}
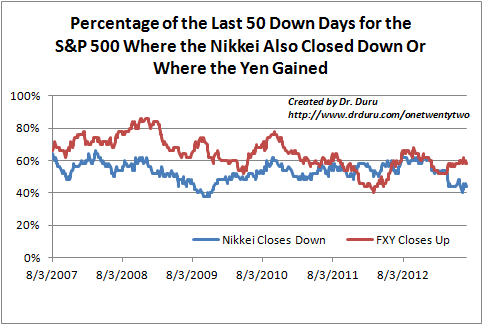
So, overall, while the Japanese yen is on a general weakening trend that appears to support higher prices on the Nikkei and likely higher prices on the S&P 500, the relationships are not reliable on a daily basis. The trends at work must be tracked over weeks and by direction. The risks over that time come from the volatility that can occur along the way. In particular, during the period where the market started roiling (panicking?) over higher interest rates in the U.S., the Japanese yen experienced several days of sudden and sharp bouts of strength where the S&P 500 managed to rally. This volatility is currently coming back down, but I suspect the sudden flares will continue as the adjustments to a new market outlook continue.
Be careful out there!
(This is an excerpt from an article I originally published on Seeking Alpha on July 2, 2013. Click here to read the entire piece.)
Full disclosure: net long Japanese yen