
Baidu (BIDU) is a Chinese internet company specializing in search, and it has a huge fan base. Unfortunately, the stock peaked in July, 2011 and has been on a roller coaster ride downward ever since. The long-term, weekly chart below shows how the 50-week moving average has defined the overall downtrend. The longer-term 200-week moving average is rushing up to meet it. I have no special insight on how 50 and 200-week moving averages tend to interact to define future trends, but I strongly expect we are about to get a great lesson about it.
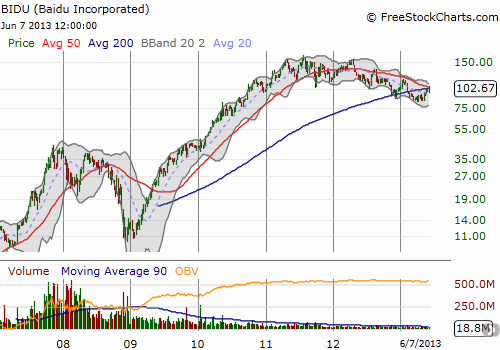
Any longer-term holder in BIDU has to be worried about more than the near 2-year downtrend in BIDU. Even more ominous is the complete lack of volume in the stock ever since the recession and financial crisis. The disappearance in volume is not just about the large absolute share price either. Note the huge surge in volume in 2007 and 2008 ranging from 200M to as much as 500M at times when the stock peaked out around $41. Starting in 2009, with the stock scraping bottom between $11 and $14, trading volume MAXED out around 100M. Volume has shriveled up on a consistent basis ever since then. BIDU now averages around 4.2M shares in trading volume per day with a $103 share price. This paltry volume is 98% below BIDU on a slow day in its pre-recession peak. The stock price then is about 40% lower than today’s stock price. So even on a price-weighted basis, trading volume has considerably declined in BIDU. It is amazing that the stock has been able to climb as much as it has on such a collapse in volume. (Note that the float now is only 277M and outstanding shares are 350M – so shares have been removed from the market. Even so, the severe decline in volume still looks significant).
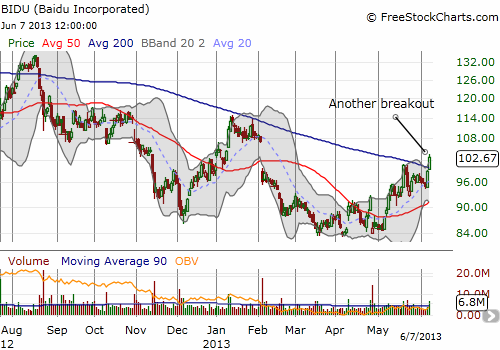
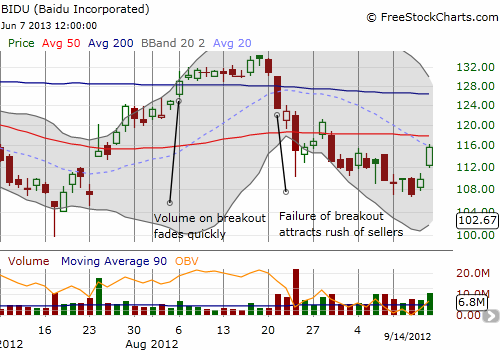
Even after putting aside the overall collapse in volume, I find volume may still matter relative to recent trading. On Friday, June 7th, BIDU broke out above its 200-day moving average (DMA) on better than average volume. This move is typically a very bullish sign, indicating that buyers are convinced of higher prices to come and are trying to sign up early for the potential gains and a much welcome end to the current downtrend. Yet, BIDU also broke out above its 200DMA at a higher point back in August, 2012. Unfortunately, volume immediately dried up on that breakout. What followed was a breakdown with heavy selling. After stabilizing for two months, the selling picked up pace again. The stock has been periodically breaking down ever since.
The charts below show the current breakout and a close-up with last year’s breakout.
Source: FreeStockCharts.com
Ultimately, I think the lesson with BIDU is to watch the volume. Bulls want to see volume maintain at least average levels on this breakout. A fade in volume should be treated as a bright red warning sign. Another breakdown below the 200DMA will be a second warning sign. A surge in selling volume will be your last warning before prices eventually tumble to lower lows. At that point, I would have to wonder whether BIDU is on a slow, grinding, and volatile decline to much lower levels.
Be careful out there!
Full disclosure: long BIDU call options