(T2108 measures the percentage of stocks trading above their respective 40-day moving averages [DMAs]. It helps to identify extremes in market sentiment that are highly likely to reverse. To learn more about it, see my T2108 Resource Page. You can follow real-time T2108 commentary on twitter using the #T2108 hashtag. T2108-related trades and other trades are posted on twitter using the #120trade hashtag)
T2108 Status: 75.8% (5th overbought day)
VIX Status: 13.1
General (Short-term) Trading Call: Hold (see below for more details)
Reference Charts (click for view of last 6 months from Stockcharts.com):
S&P 500 or SPY
SDS (ProShares UltraShort S&P500)
U.S. Dollar Index (volatility index)
VIX (volatility index)
VXX (iPath S&P 500 VIX Short-Term Futures ETN)
EWG (iShares MSCI Germany Index Fund)
CAT (Caterpillar)
Commentary
T2108 closed at 75.8%; its 5th overbought day. This is above the median duration of 4 days for an overbought period (at or above 70%) but less than the average of 7-8 days. T2108 is also still within the region of maximum downside risk as discussed in earlier T2108 Updates. This period of maximum risk will end in another 5 trading days or so, that is, by the end of next week. If T2108 remains overbought at that time, I will assume the market will continue on an extended overbought period. If the S&P 500 is below the critical 1597 level at that time, I should already be loaded up with SSO puts. If so, my tight stop will be an S&P 500 close above 1600.
The S&P 500 stalled out with a small loss of 0.4%. It was nothing dramatic, but it felt ominous given 5 straight strong up days leading into today’s trading. The chart below shows the recent action along with what I am calling the bear/bull dividing line.

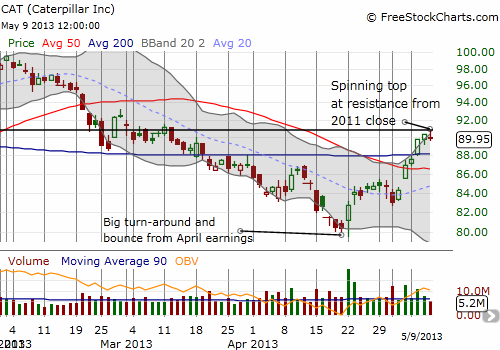
A little more ominous was trading on Caterpillar (CAT). The stock formed a “spinning top” which shows the indecision of traders. The stock has been on a tear since reversing early post-earning losses on April 22nd. The 10%+ gain has powered CAT through double resistance at the 50 and 200DMAs. The 2011 closing level is the current resistance. The trading was ominous enough to me to trigger the hedge I discussed in “This Month Of May Is Not Likely To Hurt – Just In Case, Some Hedging Ideas.” I have now loaded up on June $85 puts.

Technically, I should have waited for a confirmation with a next-day trade below today’s low (or even better a CLOSE) below the low. However, watching the madness in the currency markets pushed my hand.
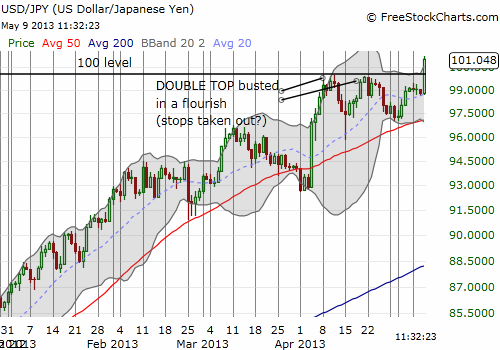
In summary, the dollar experienced a sudden surge of strength. It was enough to push EUR/USD (FXE) toward its 50DMA, and, even more importantly, push USD/JPY (FXY) above the magic psychological level of 100. Yen weakness SHOULD be a major bullish sign signalling a further reduction in risk aversion and the increased possibility of cheap(ening) yen getting borrowed to buy assets. Contrary to this neat story is the continuing breakdown of AUD/USD (FXA) (for more details on recent Aussie action see “A Mystifying Rate Cut By The Reserve Bank Of Australia.”) With the euro and pound also weakening against the U.S. dollar, I am inclined to think of this move more as a dollar-strong, than a yen-weak move, even as the Aussie surged against the yen as well. Hopefully, the signals will get sorted out in the coming days or week. Until then, I am on high alert (and making numerous quick trades shorting yen and Aussie against the U.S. dollar along with other opportunistic trades – this is the time to make them while stops are getting taken out and trade triggers are fast and loose). Here are the tell-tell charts…


Daily T2108 vs the S&P 500

Black line: T2108 (measured on the right); Green line: S&P 500 (for comparative purposes)
Red line: T2108 Overbought (70%); Blue line: T2108 Oversold (20%)
Weekly T2108

*All charts created using freestockcharts.com unless otherwise stated
Related links:
The T2108 Resource Page
Expanded daily chart of T2108 versus the S&P 500
Expanded weekly chart of T2108
Be careful out there!
Full disclosure: long CAT shares and puts, short AUD/USD
