(T2108 measures the percentage of stocks trading above their respective 40-day moving averages [DMAs]. It helps to identify extremes in market sentiment that are highly likely to reverse. To learn more about it, see my T2108 Resource Page. You can follow real-time T2108 commentary on twitter using the #T2108 hashtag. T2108-related trades and other trades are posted on twitter using the #120trade hashtag)
T2108 Status: 71.6%
VIX Status: 12.9
General (Short-term) Trading Call: Hold (see below for more details)
Reference Charts (click for view of last 6 months from Stockcharts.com):
S&P 500 or SPY
SDS (ProShares UltraShort S&P500)
U.S. Dollar Index (volatility index)
VIX (volatility index)
VXX (iPath S&P 500 VIX Short-Term Futures ETN)
EWG (iShares MSCI Germany Index Fund)
CAT (Caterpillar)
Commentary
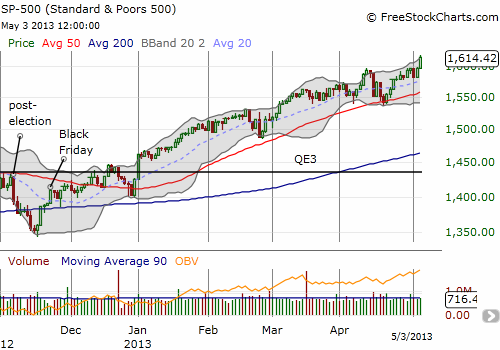
T2108 managed to hit overbought before the week ended after all. The S&P 500 surged to a new all-time high with a 1.1% gain in the wake of what the market seemed to interpret as a good employment report. However, I feel that momentum is so strong now that even a weak number could not have stopped the current technical strength (and mainstream media headlines would have attributed the strength to the market’s anticipation of more accommodation from the Fed due to weak employment numbers).

I was hoping to have a complete review of what the overhauled T2108 Model has to say about this overbought period, but I will have to save the details for another day. In the meantime, I highly recommend you read my thoughts for this month on Seeking Alpha here: “This Month Of May Is Not Likely To Hurt – Just In Case, Some Hedging Ideas.” In this piece, I update a surprising view I developed from two years ago revealing that May and the subsequent summer is only bad when it is REALLY bad. This time around, the odds favor a May that does NOT ring the selling bell.
With that backdrop, I remain uninterested in trying to fade the market here without additional technical confirmation. Setting a floor under which I would trigger a short (it was 1580 on the S&P 500), helped to avoid getting caught leaning the wrong way on the rally over the past two days. I now bump that floor up to Friday’s low – that technical level just sings out to me as a fine dividing line for short-term bear versus bull trades. This level neatly coincides with the previous all-time high and was tight resistance until Friday’s rally.
This is the 11th day of the T2108 40% overperiod and of course the first day of the 70% overperiod. According to the new T2108 Trading Model (TTM), the market is reaching toward its maximum downside risk levels over the next 10 or so trading days (two calendar weeks). The S&P 500 price prediction for the 40% overperiod is heavily biased negatively if T2108 drops below 40%. This part should be obvious given how high the S&P 500 has climbed now. Combine this risk with a median duration of about 4 days and average duration of about 7 or 8 days for the 70% overperiod, and we get one explosive combination. Thus, I definitely want to load up the truck on SSO puts with the S&P 500 CLOSING below 1597. If no decline occurs, then the S&P 500 will likely experience another extended overbought period. In fact, it makes sense for the most bullish amongst you to open up such trades here with a tight stop below 1597. I will be looking for buy-on-dip opportunities in individual stocks as long as the S&P 500 stays above 1597.
Daily T2108 vs the S&P 500

Black line: T2108 (measured on the right); Green line: S&P 500 (for comparative purposes)
Red line: T2108 Overbought (70%); Blue line: T2108 Oversold (20%)
Weekly T2108

*All charts created using freestockcharts.com unless otherwise stated
Related links:
The T2108 Resource Page
Expanded daily chart of T2108 versus the S&P 500
Expanded weekly chart of T2108
Be careful out there!
Full disclosure:
