(T2108 measures the percentage of stocks trading above their respective 40-day moving averages [DMAs]. It helps to identify extremes in market sentiment that are highly likely to reverse. To learn more about it, see my T2108 Resource Page. You can follow real-time T2108 commentary on twitter using the #T2108 hashtag. T2108-related trades and other trades are posted on twitter using the #120trade hashtag)
T2108 Status: 61.6%
VIX Status: 12.7
General (Short-term) Trading Call: Hold
Reference Charts (click for view of last 6 months from Stockcharts.com):
S&P 500 or SPY
SDS (ProShares UltraShort S&P500)
U.S. Dollar Index (volatility index)
VIX (volatility index)
VXX (iPath S&P 500 VIX Short-Term Futures ETN)
EWG (iShares MSCI Germany Index Fund)
CAT (Caterpillar)
Commentary
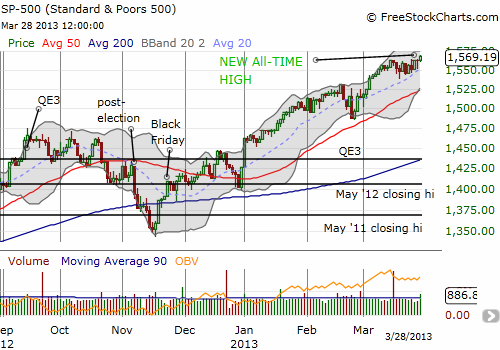
March was one of the most uneventful months for T2108 that I can remember. This is only my FOURTH T2108 piece regarding March trading. Ironically, this is the kind of pace I originally envisioned when I start writing the T2108 Update several years ago. Adding to the irony is a feeling of disconnect as another major index hits all-time highs, this time the S&P 500 (SPY), without T2108 entering overbought territory.
There is a lack of enthusiasm and celebration about the market’s achievements, and I believe T2108’s lackluster drift is a part of that. Of course, in the last update, I demonstrated that T2108 is actually typically NOT overbought during all-time highs on the S&P 500. I am STILL trying to absorb that lesson, and I have added it to the list of research questions I hope to tackle in coming months (my data mining project on T2108 is coming to an end soon, and I am anxious to share the results! Teaser – what I have learned has fundamentally altered the way I will use T2108 as a trading indicator in the future).
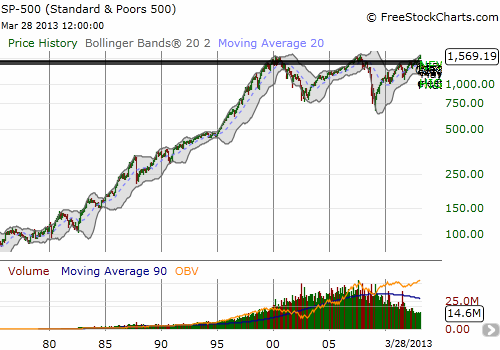
The following charts provide a close-up and a monthly view of the S&P 500. I juxtapose these in honor of the new all-time high. (In order to preserve my annotations for the daily chart, I had to leave them on the monthly chart. Thus the garbled mess in the upper-right corner and the dark horizontal lines across the top).


Astute observers will note the dramatic drop-off in trading volume in recent years. The trend downward is clear in this monthly chart. It remains one of those things that does not matter until it does. I still suspect that one day, during the next massive correction in the stock market, we all may have a different interpretation of this poor volume than we do now (that it no longer matters).
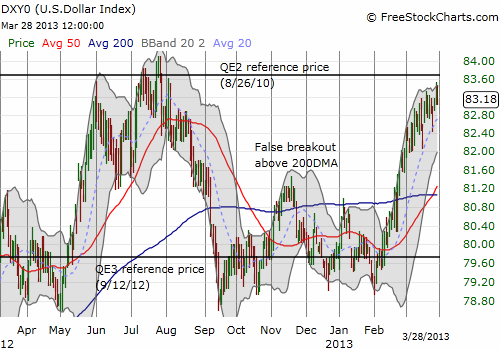
Two other things are happening on these hallowed grounds that I never would have guessed a few months ago. At the same time the S&P 500 is charging ahead, the U.S. dollar index continues to gain ground, and Apple (AAPL) has gone into retreat again.
The U.S. dollar is in rally mode as it sustained its pop over its 200DMA. Quantitative easing is a long, distant memory as the dollar has broken away from its QE3 price and is now challenging its QE2 price. I am inclined to believe that something must give way soon and perhaps even the Federal Reserve will get active again in dovish talk in an effort to drive the dollar back to earth. The Fed must be getting at least a little nervous that the dollar’s strength could soon start to hinder the anemic recovery just as profits overseas for U.S. companies are likely to slow partially thanks to entrenching weakness in Europe.

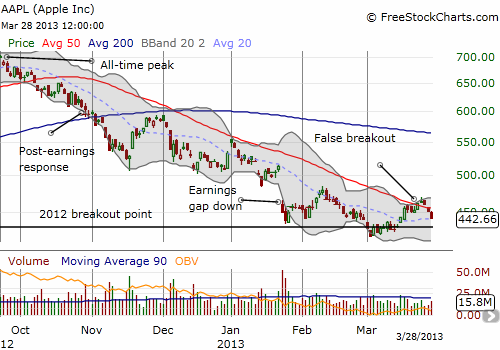
Not only has Apple (AAPL) experienced extreme relative weakness ever since hitting its last all-time high in September, but the stock added insult to injury by completing a false breakout above its 50DMA just as the S&P 500 hits its new all-time high. This is another point where I think the divergence in performance simply cannot continue much longer.

Apple investors must engage in a bit of cognitive dissonance to reconcile this diverge of AAPL from the general market. It certainly can subdue any nascent feelings of euphoria over the S&P 500’s new all-time high. The one small saving grace is that the 20DMA is finally turning upward. This is the first fundamental change in trend since the sell-off began. Overall, however, this false breakout is consistent with my wariness about calling a bottom in AAPL.
April should prove to be a critical, fulcrum month for the stock market. It is tax time, and then May’s seasonal weakness will begin looming larger and larger. The pressure will feel even more intense given all the profits many may want to protect before the summer. But first, April trading begins on Monday. It is the beginning of a month and a new quarter – a ripe recipe for a big rally to confirm follow-through on the all-time high.
Daily T2108 vs the S&P 500

Black line: T2108 (measured on the right); Green line: S&P 500 (for comparative purposes)
Red line: T2108 Overbought (70%); Blue line: T2108 Oversold (20%)
Weekly T2108

*All charts created using freestockcharts.com unless otherwise stated
Related links:
The T2108 Resource Page
Expanded daily chart of T2108 versus the S&P 500
Expanded weekly chart of T2108
Be careful out there!
Full disclosure: long VXX shares and puts
