(T2108 measures the percentage of stocks trading above their respective 40-day moving averages [DMAs]. It helps to identify extremes in market sentiment that are highly likely to reverse. To learn more about it, see my T2108 Resource Page. You can follow real-time T2108 commentary on twitter using the #T2108 hashtag. T2108-related trades and other trades are posted on twitter using the #120trade hashtag)
T2108 Status: 60.7%
VIX Status: 14.2
General (Short-term) Trading Call: Hold – but if you are a bullish scalper, a short-term buy with a tight stop makes sense here. See below.
Reference Charts (click for view of last 6 months from Stockcharts.com):
S&P 500 or SPY
SDS (ProShares UltraShort S&P500)
U.S. Dollar Index (volatility index)
VIX (volatility index)
VXX (iPath S&P 500 VIX Short-Term Futures ETN)
EWG (iShares MSCI Germany Index Fund)
CAT (Caterpillar)
Commentary
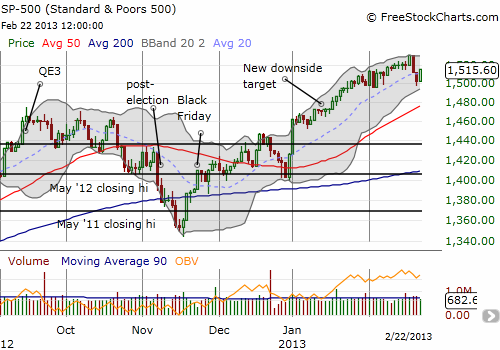
The last T2108 Update was aptly titled “Quasi-Oversold? Three Reasons to Brace for A Quick Bounce.” While I warned that the timing could be squishy, Friday or Monday, the bounce arrived right on schedule. It produced a very strong reversal of Thursday’s losses that took the S&P 500 above its 20DMA, the line that defined the primary uptrend. (I strongly recommend reading that last update if you have not already done so. It contains descriptions of several key technical signals that allowed me to surmise the S&P 500 was in a quasi-oversold state).

A 0.9% gain does not seem like a big deal, but it is here given the context of the quasi oversold conditions and the complete reversal of a previous day’s loss. The success of this particular forecast now opens up a brand new opportunity for using T2108. Now it seems that the rate of change in T2108 can provide a proxy for oversold conditions (I doubt it will be quite as powerful for defining overbought conditions). As I mentioned in the last update, I will have to do some analysis to formalize the notion that the rate of change in T2108 may have meaning, but I think there is promising potential.
So now what?
If you are bullish, there is an opportunity to go long with a tight stop below the 20DMA or, for the more aggressive, below Friday’s low. This is not the trade I want to make, and I am looking to fade this bounce if/once T2108 wanders into overbought territory again. Otherwise, I will just keep holding my remaining SSO puts. It was hard to watch the profits on my remaining puts erode, but I am sticking to the overall strategy. Locking in some profits earlier helps firm the resolve.
I expect last week’s 5+ year high to hold tight as resistance unless/until a fresh, positive catalyst arrives – like a pleasant surprise in the budget battles. Until then, the technical machinery for T2108 suggests that this bounce will be the last before a correction larger than the previous 2-day, 1.8% sell-off. My initial downside target remains the same.
The VIX once again confirmed the importance of the 15.32 level. It is now in full retreat from this resistance. For my strategy of combining VXX shares and puts, I neglected to add to my puts when the VIX charged into resistance. At the time, I was overly focused on timing my SSO sale. At some point, I will write a separate piece formalizing this strategy. It is essentially a bet that VXX is locked into a perpetual downtrend with brief and abrupt interruptions to the upside. It requires making timely sales of the puts and keeping the delta balanced on the position when refreshing it (delta measures the change in price for every $1 move in the stock).
Daily T2108 vs the S&P 500

Black line: T2108 (measured on the right); Green line: S&P 500 (for comparative purposes)
Red line: T2108 Overbought (70%); Blue line: T2108 Oversold (20%)
Weekly T2108

*All charts created using freestockcharts.com unless otherwise stated
Related links:
The T2108 Resource Page
Expanded daily chart of T2108 versus the S&P 500
Expanded weekly chart of T2108
Be careful out there!
Full disclosure: long VXX shares and puts, long SSO puts
