(T2108 measures the percentage of stocks trading above their respective 40-day moving averages [DMAs]. It helps to identify extremes in market sentiment that are highly likely to reverse. To learn more about it, see my T2108 Resource Page. You can follow real-time T2108 commentary on twitter using the #T2108 hashtag. T2108-related trades and other trades are posted on twitter using the #120trade hashtag)
T2108 Status: 56.4% (ends a 1-day overbought period
VIX Status: 15.2
General (Short-term) Trading Call: Lock in some profits on shorts. Otherwise, hold.
Reference Charts (click for view of last 6 months from Stockcharts.com):
S&P 500 or SPY
SDS (ProShares UltraShort S&P500)
U.S. Dollar Index (volatility index)
VIX (volatility index)
VXX (iPath S&P 500 VIX Short-Term Futures ETN)
EWG (iShares MSCI Germany Index Fund)
CAT (Caterpillar)
Commentary
After plunging yesterday by 10.5%, T2108 plunged another 10.3% today. The collapse from extreme overbought conditions has been so swift that I have to consider the very real possibly that the market is essentially in a type of short-term oversold condition: what I will call quasi-oversold. This state will require further data analysis to formalize, but the idea is that ANY time a market indicator moves very rapidly in a given direction outside of norms, the extreme must be considered dangerous to play in the same direction before some kind of resting condition occurs.
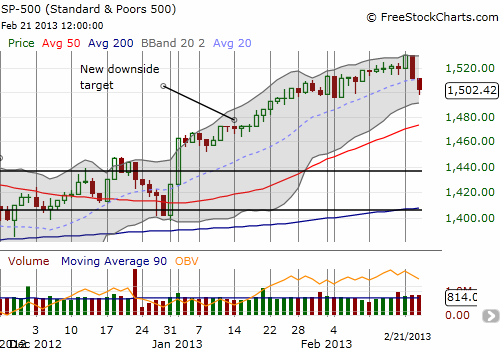
The S&P 500 has fallen 1.8% in two days, right at the cusp of the first downside threshold for the S&P 500 falling from extreme overbought conditions (from the overbought trading rules). Recall that although the last overbought period lasted just one day, I am keeping in mind that it may have really been the final gasp of the previous 31-day (extreme) overbought condition. As such, it is time to think about a sharp relief rally from here.

I posted a close-up so it is clear that the S&P 500 sliced cleanly through the 20DMA, thus ending the primary (short-term) uptrend. However, it bounced slightly off the lows which mark the lows from the last sharp swoon on February 4th. Reason #1 to suspect a sharp relief, quasi-oversold bounce could come tomorrow. Moreover, the S&P 500 managed to climb back above the psychologically important even number 1500.
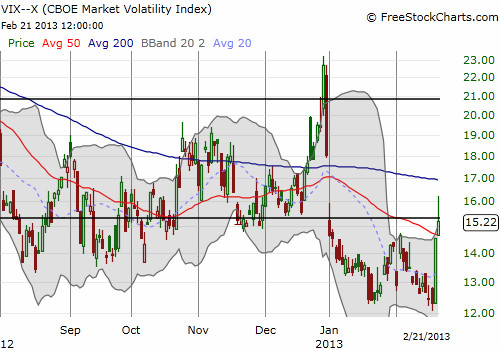
In the last T2108 Update, I warned that bears cannot get aggressive about shorting until the VIX cracks resistance above 15.35 (I rounded to say 15, but the breakout level from the summer swoon in 2011 was actually 15.35). Note in the chart below how conveniently the VIX closed right below that resistance. Such a false breakout could have sucked in overly aggressive shorts who will scramble for cover if the S&P 500 gaps up by any amount tomorrow. This is reason #2 to expect a high likelihood for a quasi-oversold bounce.

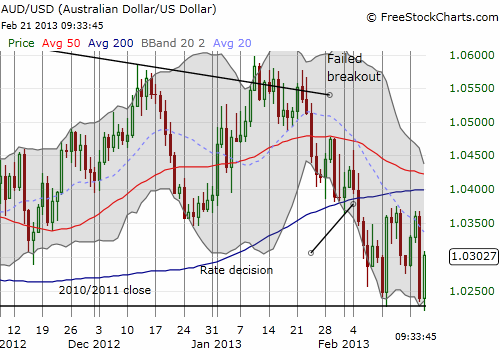
Finally, my key bear/bull indicator from the currency markets, the Australian dollar (FXA), produced its own false move (a breakdown). Earlier in the day, the key support level from the 2010 and 2011 levels was breached. It even sucked me in as I re-established a very small short position in AUD/USD. But no follow-through occurred and instead, as I type, the stubborn Aussie is already producing a sharp oversold rally. This rally could portend what is to come for stocks by the time of the U.S. open. This is reason #3 to expect a quasi-oversold bounce.

Now, after seeing this evidence, please remember that the science here is not exact. Friday may be a completely boring day and instead the bounce comes on Monday after everyone gets a chance to rest their frayed nerves over the weekend. Then again, there is a lot of headline risk now as the U.S. approaches yet another maddening budget battle deadline in the wrangling over sequestration. Since I loaded up on SSO puts into the false breakout on Tuesday, I promptly sold half the position to lock in profits today. I plan to hold onto the rest through whatever oversold bounce comes as I am still eying my revised downside target as shown in the chart above.
Daily T2108 vs the S&P 500

Black line: T2108 (measured on the right); Green line: S&P 500 (for comparative purposes)
Red line: T2108 Overbought (70%); Blue line: T2108 Oversold (20%)
Weekly T2108

*All charts created using freestockcharts.com unless otherwise stated
Related links:
The T2108 Resource Page
Expanded daily chart of T2108 versus the S&P 500
Expanded weekly chart of T2108
Be careful out there!
Full disclosure: long VXX shares and puts, long SSO puts, net short British pound and the Australian dollar, long Japanese yen
