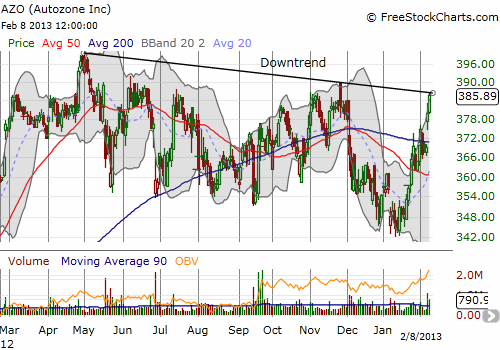
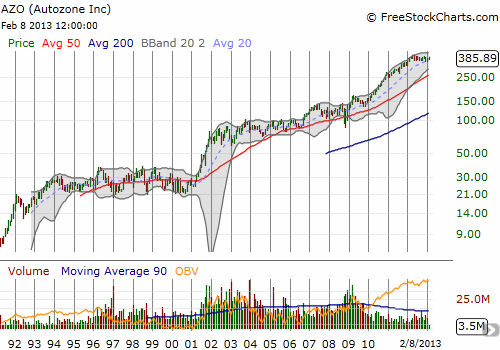
Autozone (AZO) was a banner stock coming out of the 2001 recession. In 2001 alone, AZO logged a 152% gain. Over the next six years, AZO gained another 67%. During the financial panic in 2008, AZO plunged but did not even come close to erasing all those hard-fought gains. In 2009, the stock barely paused for the historic March, 2009 lows. From 2009 to 2011, AZO logged another 133% in gains. In early 2012, this rally stalled out, and the stock steadily dripped lower. While the S&P 500 recovered from the May, 2012 swoon by the end of that summer, AZO has yet to complete a recovery. That completion may finally be at hand. On Friday, AZO rallied for the second straight day on strong buying volume to close just below the downtrend from its all-time high. The stock is now firmly trading above its 50 and 200-day moving averages (DMAs).
The charts below show the short-term and long-term stories.


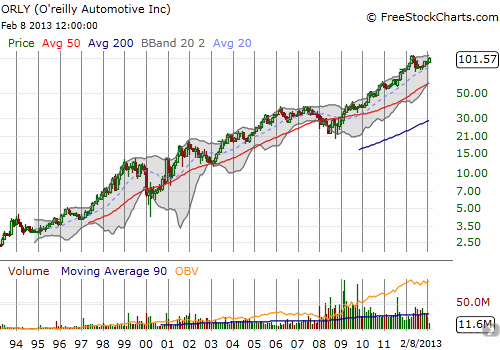
I only wish I could say I have been a long-time shareholder in AZO. Instead, over the past several months I have adopted a strategy of defying the downtrend by buying call options on dips and selling rips. Last week’s rip came in sympathy with standout earnings from competitor O’Reilly Automotive Inc. (ORLY). ORLY has had a strong secular record similar to AZO’s. Clearly, there is money to be made in auto parts!

Source: FreeStockCharts.com
If AZO pulls back from this resistance, I would NOT be interested in shorting it. Trying to short stocks like AZO on such strong, long-term secular trends is almost like playing Russian Roulette. Instead, I think it makes much more sense to look for the next buying opportunity. A breakout (and follow-through) from here would be a definite buy signal. A stop can be placed somewhere below the 200 or 50 DMA.
Be careful out there!
Full disclosure: no positions
