Earnings announcements are supposed to reveal the fundamental strength (or weakness) in a company. The reaction to those earnings should indicate the underlying fundamentals of a company. Yet, there is no time like earnings where the contrast between the true fundamentals of a company and market sentiment can clash in the most dramatic fashion. Case in point is Verisign (VRSN).
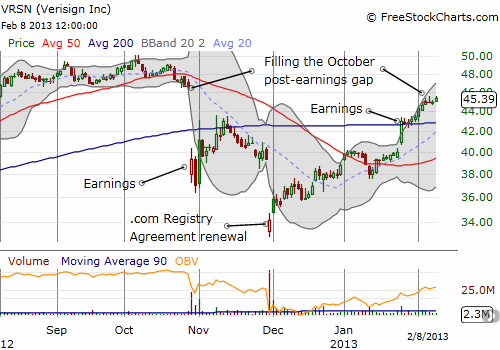
I will not repeat the fundamentals from the earnings announcements from the last two quarters: they are not needed for interpreting the recent trading action. Instead, I will focus on the chart as an example of the opportunity that can present itself when the market over-reacts on the negative side.

Source: FreeStockCharts.com
First, note that VRSN has essentially closed the October post-earnings gap down this past week. It is the end result of a strong 38% upward streak from another convulsion around VRSN’s .com registry agreement renewal. This is an important moment for the stock: it forms a perfect tension that should lead to either a large upside or downside reaction once momentum is re-established in one direction or the other. Here is a list of other important chart lessons that can be applied in other situations.
- On Jan 3rd, VRSN broke through 50-day moving average (DMA) resistance, but received no follow-through for a week. After that, the stock sagged again, cracking the 50DMA on high volume. Two days later, a fresh effort to break the 50DMA resistance DID receive follow-through and VRSN has not looked back since. The big lesson here is the importance of patiently waiting for follow-through in playing breakouts. Similarly, a trader going short could have avoided whiplash by patiently waiting for follow-through on the breakdown below the 50DMA.
- On Jan 25th, VRSN broke through 200DMA resistance. This was a bigger deal since this line provided stiff resistance in the immediate aftermath and relief rally following October earnings. It took three more trading days to get the follow-through, but VRSN has not looked back since. Same lesson learned for the 50DMA.
- In both convulsions, October and November, VRSN plunged well below the lower-Bollinger Band (BB). The BB is defined by the grey area and approximates short-term expected volatility in the stock (in this case based on the past 20 days of trading). These over-reactions pushed the stock to significant extremes that set up strong relief rallies. This action represents a good dual lesson in avoiding selling in a panic. On the flip side, look to buy in a panic, especially sell puts, as sellers get washed out in these events leaving only upside for at least a short time.
I missed the opportunity from the October earnings gap down, but I was all over the November gap down. I honestly did not understand why the market had reacted so negatively, but I figured it was on-going bad vibes from the last earnings announcement. However, I was also less aggressive than I should have been. I bought a single March $27 2013 call option for $1.10. I chose a long-dated call to give the trade plenty of time to work out. It seemed very reasonable to expect VRSN to gain 10% or more in the next four months given the stock had fallen 28% in just the last month; this is an assumption that recent volatility is indicative of potential future volatility.
VRSN’s immediate performance surpassed my best hopes, and I found myself with a double in two days. Options trading rules typically recommend locking in such rapid gains, so I did. Of course, as it happened, I could have gone to sleep on the call and woken up now with a hefty profit. The chart for this option says it all.

Source: Etrade.com
In retrospect, I should have just set a stop. For example, a stop below the low of the day after the .com registry agreement renewal would have preserved a portion of profits while enabling me to participate in any further upside. I am not sure whether I would have been brave enough to see the call all the way up to its current price of $8. Instead, around the 50DMA I probably would have locked in profits and then bought new out of the money call options (assuming I still had bullish feelings of course).
Traders and investors will likely have mixed feelings on VRSN. Bulls who held on are nervously wondering whether they should count their lucky stars and bail now that October’s losses have been erased. Bears who shorted after VRSN’s convulsions are nervously fearing that the current recovery may indicate that the company is just fine, especially after the very positive reaction to January’s earnings. Here again the charts should help determine the trade. A close above $46.50 with follow-through is a freshly bullish sign and can be bought. A breakdown below the 200DMA with follow-through indicates a strong likelihood that the relief buying has finally exhausted itself for now.
Be careful out there!
Full disclosure: no positions
