The market continues to throw up a lot of interesting charts, particularly on the bullish side. This chart review takes a quick look at Shutterfly (SFLY), BlackBerry (BBRY), Weight Watchers (WTW), Peabody Energy (BTU), and the Australian dollar (AUD/USD or FXA).
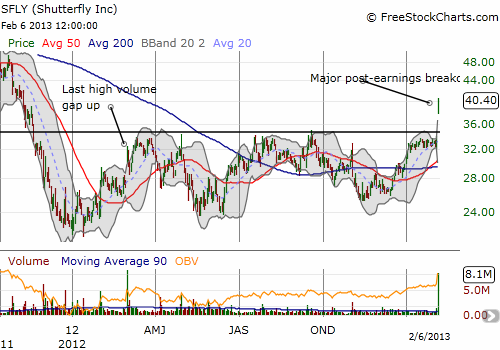
SFLY just reported earnings, and the market clearly loved it. The stock printed a very convincing breakout and is now a buy on the dips candidate. Note that an earlier gap up with similarly high trading volume failed to generate much follow-through.
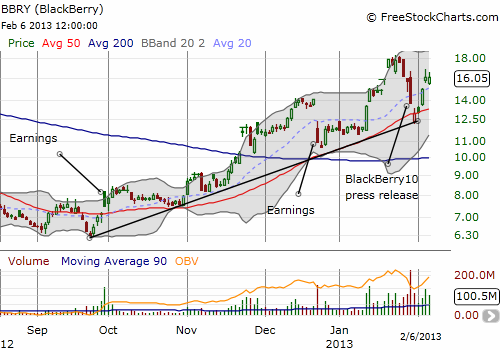
BBRY printed a picture-perfect follow-through bouncing off the 50-day moving average (DMA) support I discussed over the weekend. Oh if I had only noticed this bullish pattern on Friday! It is difficult to buy at this point, so watch for another retest of the 50DMA which clearly defines the current uptrend from the bottom. If BBRY powers through to set new highs, I will just have to cling to the vapors of what could have been…
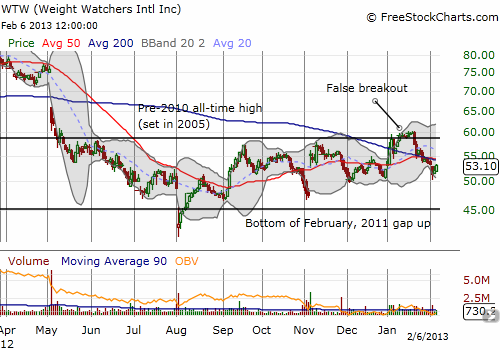
Weight Watchers (WTW) was an almost “obvious” pick to start the year with New Year’s resolutions full of promises to lose weight. A breakout last month made it seem like WTW would finally take off for the races. Instead, enthusiasm quickly waned from there. I hope the same thing has not happened to the diets with the year still young! I still like the stock and expect it to slowly but surely grind its way back to previous glory.
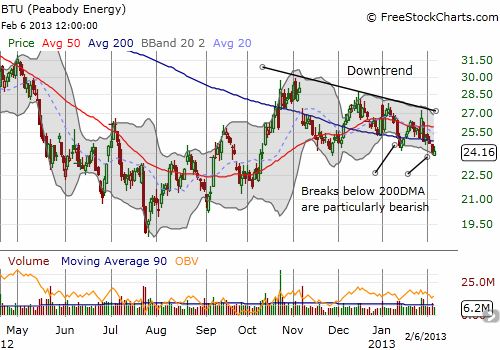
Peabody Energy (BTU) fell a bit in sympathy with poor earnings results from fellow coal company Arch Coal (ACI). The outlook for coal stocks continues to look bleak. BTU has again fallen below the critical 50 and 200DMAs. The downtrend from the November high has essentially resumed the bigger downtrend that began at the peak from early 2011.
The Australian dollar has broken down below its 200DMA versus the U.S. dollar (AUD/USD or FXA). The drop to 1.03 has been a long time in the making after the currency pair failed to hold a breakout from the downtrend starting at the all-time peak in 2011. The next natural support comes around the 2010/2011 closes. It will take more bearishness and/or rate cuts out of the Reserve Bank of Australia (RBA) to get a drive back to parity. I will have more to say about the Aussie’s rough week in another post. I think the implications for the overall stock market from this decline are bearish. For example, see my last piece on this here: “With A Rate Decision Looming, Weakening Australian Dollar Sends Poor Signal For Stocks.”
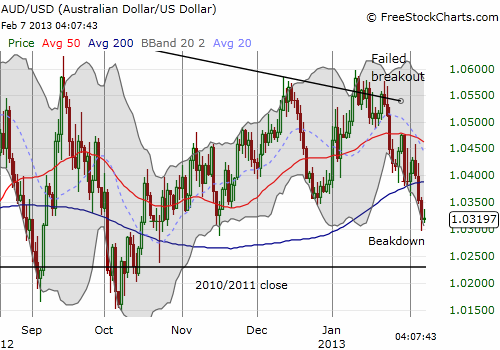
Source: FreeStockCharts.com
Be careful out there!
Full disclosure: long WTW
