It is time for Apple (AAPL) earnings again, but this time around I did not have a chance to update my price-based analysis. Last time around (October 25, 2012), AAPL dropped a mere 0.9% post-earnings after bouncing off the 200DMA for the first re-test since November, 2011. The stock eventually proceeded to continue a strong sell-off that had been in place since the all-time highs the previous month. Essentially, that selling has yet to end.
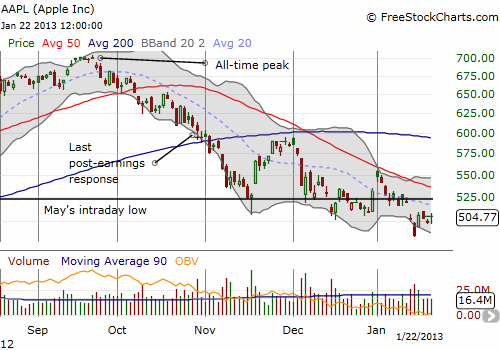
Source: FreeStockCharts.com
I updated my assessment of Apple’s prospects last week in “Apple $432 Support Back In Play But A Bottom May Have Already Arrived.” This review colors my current analysis of the post-earnings trade in AAPL. Essentially, I think AAPL is a coiled spring ready to launch significantly higher. However, if AAPL disappoints, the stock should crater quickly toward $432 support. I think another lackluster response is the least likely scenario. I have positioned appropriately with a weekly 460/445 put spread and a Feb (monthly) 540/550 call spread (early morning update on Jan 23: I am likely to close out the short-end of the put spread if it drops to $0.55 or so. This would leave me long just the weekly $460 put, but it would take a drop of 10% or so from current prices to generate a profit on the downside). Assuming that an adverse reaction will unfold quickly, I saw little reason to purchase the put spread beyond this week’s expiration. If the reaction is somehow mild, I am assuming it will be part of AAPL’s bottoming, and the stock will eventually recover by February’s expiration to around $550, 2013’s high.
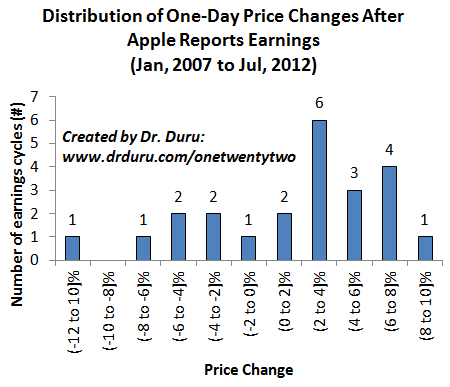
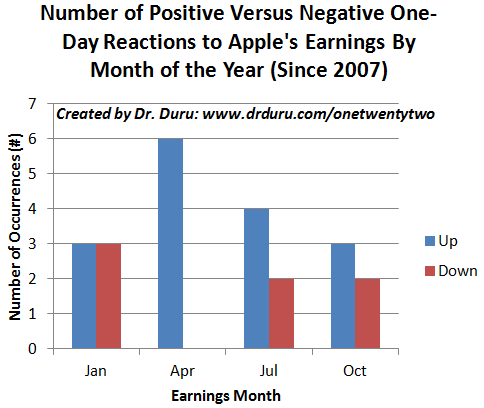
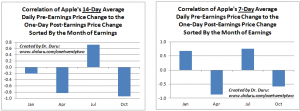
Interestingly, the price history on AAPL’s earnings suggests another post-earnings stalemate is in the making. The charts below are not updated for October’s earnings. Even with October’s data point, they would not alter the following implications:
- Apple is overall most likely to trade up post-earnings
- January post-earnings is 50/50 up or down
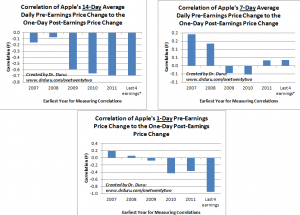
- The marginal 7-day and 14-day average price changes (0.6% and 0.4% respectively) indicate that AAPL is biased to the downside using all of history but biased to the upside based on the history of January earnings.
In other words, THESE data suggest a stalemate. That is, odds are effectively 50/50 on whether AAPL will pop or drop in the day after earnings. Once again, no loud bells are ringing like the earnings from last April and July. All things considered, I think a hedged approach makes sense.
Click following charts for larger views….
Be careful out there!
Full disclosure: long AAPL shares, put spreads, and call spreads
