(This is an excerpt from an article I originally published on Seeking Alpha on January 11, 2013. Click here to read the entire piece.)
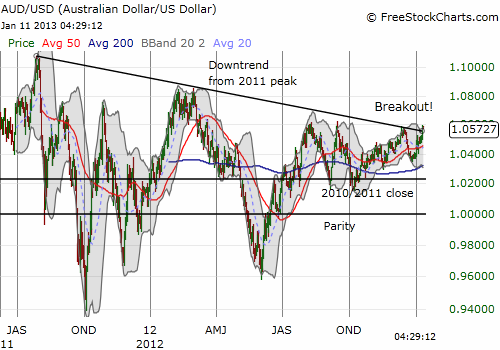
On Thursday, January 10th, China reported export growth much larger than forecasters expected. {snip} This surge helped push the Australian dollar (FXA) far enough to finally break a long-standing downtrend against the U.S. dollar.

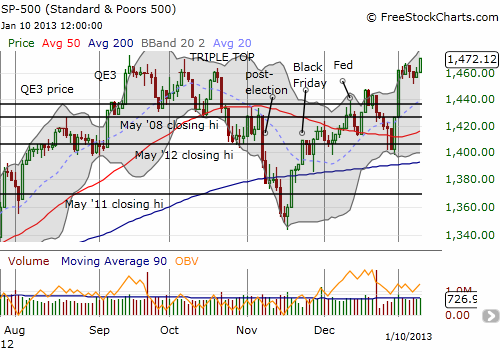
The timing of the breakout is notable because at the same time, the S&P 500 (SPY) rallied to the edge of last year’s triple top, the first leg of which occurred on September 14th, the day after the U.S. Federal Reserve announced QE3. {snip}

Source for charts: FreeStockCharts.com
In other words, the typically strong correlation between the Australian dollar and the S&P 500 that I have frequently referenced had broken. The correlation is now poised to re-establish itself with the breakout of AUD/USD and the testing of 52-week and multi-year highs by the S&P 500. The key to resolution of this convergence may be iron ore prices.
{snip} Last August, the blog “Brazilian bubble” posted a chart showing the strong correlation between the Australian dollar and iron prices with this summary:
“The rolling annual correlation over the entire period 2005 to current runs at around 70%, and through 2008-2010 this was closer to 90%. By contrast, in the year to date correlation is running at just 12%.”

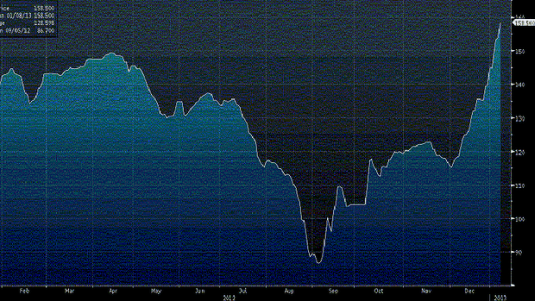
{snip} In just four months, iron ore has gone from three-year lows to 15-month highs!

Source: The Sydney Morning Herald
Note that the Australian dollar actually sold-off during the first half of the acceleration in iron ore prices in December. It seems that instead of a tight correlation, iron ore is now leading the Australian dollar. {snip}
…A continued rally across the board would be a powerful confirmation of bullish momentum in financial markets. A coordinated pullback might confirm that markets have rallied beyond what the economic fundamentals will support. {snip}
Be careful out there!
(This is an excerpt from an article I originally published on Seeking Alpha on January 11, 2013. Click here to read the entire piece.)
Full disclosure: long SSO puts, short AUD/USD
