(T2108 measures the percentage of stocks trading above their respective 40-day moving averages [DMAs]. It helps to identify extremes in market sentiment that are highly likely to reverse. To learn more about it, see my T2108 Resource Page. You can follow real-time T2108 commentary on twitter using the #T2108 hashtag. T2108-related trades and other trades are posted on twitter using the #120trade hashtag)
T2108 Status: 67.1%
VIX Status: 15.6
General (Short-term) Trading Call: Hold
Reference Charts (click for view of last 6 months from Stockcharts.com):
S&P 500 or SPY
SDS (ProShares UltraShort S&P500)
U.S. Dollar Index (volatility index)
VIX (volatility index)
VXX (iPath S&P 500 VIX Short-Term Futures ETN)
EWG (iShares MSCI Germany Index Fund)
CAT (Caterpillar)
Commentary
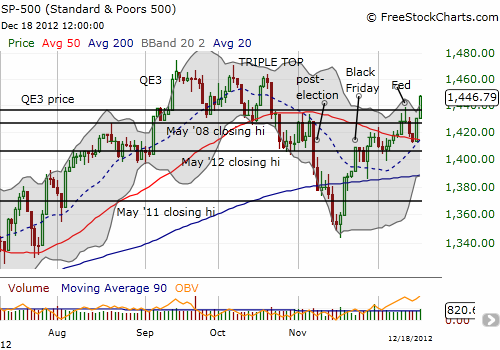
Overbought conditions are now no longer just over the horizon but now right next door. At 67.1%, T2108 is at 2-month highs. At that time, the S&P 500 was in the process of printing the last peak of a triple top. Now, the S&P 500 making a strong push upward; its 1.2% gain was good enough to punch through the upper-Bollinger Band. I was too focused on execution on my last Apple (AAPL) trade on Friday to recognize the good risk/reward of playing SSO calls for a bounce off the 50DMA. The typical trading patterns on the S&P 500 were lined up with support to suggest that at least a 2-day bounce had a strong likelihood (see ”
S&P 500 Performance By Day Of Week And The Changing Nature Of Trading Tuesdays“).

As the S&P 500 nears resistance from the triple top, it has left a trail of impressive accomplishments. In reverse chronological order:
- The S&P 500 is above its QE3 price once again
- The S&P 500 bounced nearly perfectly off its 50DMA support which also happened to coincide with a sharply increasing 20DMA. The S&P 500 is also trading well above its still increasing 200DMA. Buying volume over the 2-day bounce has been relatively strong.
- The post-Fed fade is faded: all losses from post-Fed selling have been reversed. I anticipated this reversal, but it came a few days later than I expected.
- Post-election losses have been reversed.
- The Black Friday trade is alive and kicking after experiencing a close call.
So while it is easy to look ahead and get bearish because of looming overbought conditions, it is just as easy to look behind and assume bullish momentum will continue. It is a tension that will continue to play out in the midst of Fiscal Cliff headlines (I love how the major media headlines explain every market jiggle now as either “because of” or “in spite of something going on with the Fiscal Cliff”). Again, for the record, I am optimistic about the possibilities for a resolution, but I am largely leaving the Fiscal Cliff out of my trading calculations.
Finally, the volatility index, VIX, has plunged these last two days and is back to scraping near its lows. This has caused VXX to set fresh all-time lows (yet again). I remain in shares and puts VXX with a small net bearish bias.
Daily T2108 vs the S&P 500

Black line: T2108 (measured on the right); Green line: S&P 500 (for comparative purposes)
Weekly T2108

*All charts created using freestockcharts.com unless otherwise stated
Related links:
The T2108 Resource Page
Expanded daily chart of T2108 versus the S&P 500
Expanded weekly chart of T2108
Be careful out there!
Full disclosure: long VXX shares and puts
