(T2108 measures the percentage of stocks trading above their respective 40-day moving averages [DMAs]. It helps to identify extremes in market sentiment that are highly likely to reverse. To learn more about it, see my T2108 Resource Page. You can follow real-time T2108 commentary on twitter using the #T2108 hashtag. T2108-related trades and other trades are posted on twitter using the #120trade hashtag)
T2108 Status: 57.9%
VIX Status: 16.6
General (Short-term) Trading Call: Hold
Reference Charts (click for view of last 6 months from Stockcharts.com):
S&P 500 or SPY
SDS (ProShares UltraShort S&P500)
U.S. Dollar Index (volatility index)
VIX (volatility index)
VXX (iPath S&P 500 VIX Short-Term Futures ETN)
EWG (iShares MSCI Germany Index Fund)
CAT (Caterpillar)
Commentary
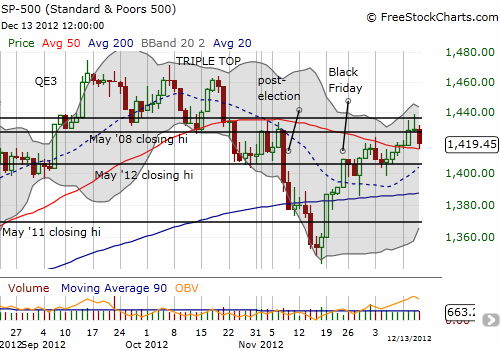
In yesterday’s T2108 Update, I pointed out how the S&P 500 faded two days in a row from resistance formed by its QE3 price. Today delivered the follow-through with the S&P 500 dropping 0.6%. This marks the classic “fade the Fed rally” move. With a picture-perfect bounce off the lows at the 50DMA, the “fade the fade” move is already getting set up.

I fully expect the S&P 500 to bounce right back to return to its price before the Federal Reserve’s latest statement on monetary policy. T2108 has fallen back to 57.9%, relieving the overbought pressure that had built up going into this week. As I mentioned yesterday, without an overbought reading, shorting the S&P 500 makes the most sense after the index closes below its 50DMA. If/when the index manages to overcome QE3 resistance, I will assume the index will be off to the races on an overbought rally.
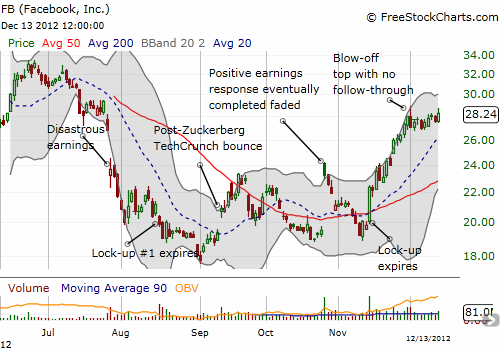
Speaking of off to the races, Facebook (FB) has been on a tidy run-up since its last lock-up expiration. In just one month, FB has gained 42%. The stock has benefited from a lot of positive news flow and a notable lack of negative news flow – a winning combination that makes everyone forget why FB had become one of the most hated stocks on the planet for a while. Another lock-up expiration on Friday is likely to pass as a non-event. From the chart, it looked like FB started December with a blow-off top: a rally hitting the upper-Bollinger Band followed by a sell-off to close lower than the previous day. However, since then, FB has not traded lower. In fact, it has steadily crept up higher in what NOW looks like a coiled spring ready to burst higher.

Despite this more bullish outlook on FB, I am betting that in the fullness of time much of this counter-trend run-up will get reversed. I am net short FB shares as well as long calls in case I am correct about a fresh run-up. Anywhere between $30-33 looks like a convenient point for a cap to the rally. Manage to get passed that and a larger and larger cadre of sellers await as FB approaches its $39 price.
Daily T2108 vs the S&P 500

Black line: T2108 (measured on the right); Green line: S&P 500 (for comparative purposes)
Weekly T2108

*All charts created using freestockcharts.com unless otherwise stated
Related links:
The T2108 Resource Page
Expanded daily chart of T2108 versus the S&P 500
Expanded weekly chart of T2108
Be careful out there!
Full disclosure: long FCX; long AAPL shares, call and put spreads; long JKS
