(T2108 measures the percentage of stocks trading above their respective 40-day moving averages [DMAs]. It helps to identify extremes in market sentiment that are highly likely to reverse. To learn more about it, see my T2108 Resource Page. You can follow real-time T2108 commentary on twitter using the #T2108 hashtag. T2108-related trades and other trades are posted on twitter using the #120trade hashtag)
T2108 Status: 29.6%
VIX Status: 18.6
General (Short-term) Trading Call: Hold (consider buying choice longs)
Reference Charts (click for view of last 6 months from Stockcharts.com):
S&P 500 or SPY
SDS (ProShares UltraShort S&P500)
U.S. Dollar Index (volatility index)
VIX (volatility index)
VXX (iPath S&P 500 VIX Short-Term Futures ETN)
EWG (iShares MSCI Germany Index Fund)
CAT (Caterpillar)
Commentary
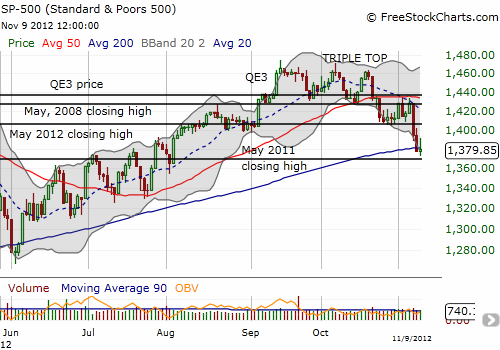
T2108 dropped below 30% for the first time since June 14th which was just two weeks into the S&P 500’s bounce from the June lows. Back in 2010, T2108 would stubbornly refuse to drop any lower than about 30%, creating a new (albeit temporary) definition of oversold conditions. With the S&P 500 (SPY) now clinging to support at the 200DMA, I am naturally wondering whether the market is oversold “enough” to warrant accumulating longs more and more aggressively.

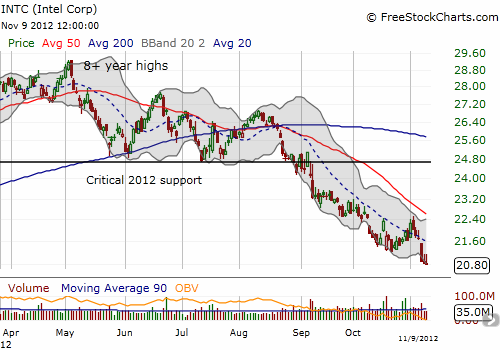
Of course, I previously projected that the S&P 500 would hit true oversold levels, T2108 <= 20%, once it retested its 200DMA. So Friday's test came much earlier than I was expecting (or hoping). I mention this because it means I am predisposed to thinking that the index is oversold. This test has very likely failed IF the S&P 500 sells off again following Friday's marginal close back under the 200DMA. With the S&P 500 solidly bouncing above the 200DMA earlier in the day, I decided T2108 was indeed oversold enough. I purchased some Dec SSO calls and SSO shares. My pre-existing Nov SSO calls have a small chance of at least breaking even this week, but I am noting that shares are more preferable given it seems patience and more patience will be required to see any bullish thesis run its course. The gyrations of political bargaining over the Fiscal Cliff are sure to take the market on some chills, thrills, and spills in coming weeks. As I wait out the bullish case, I am keenly aware that some individual stocks look particularly bad. While I sold my puts on Intel (INTC) on Friday, the stock still looks very bearish to me and is one to fade on any rally. I actually wish I still held the puts given the stock faded back to its lows on the day after I did so. This week's expiration loomed large in my decision-making.

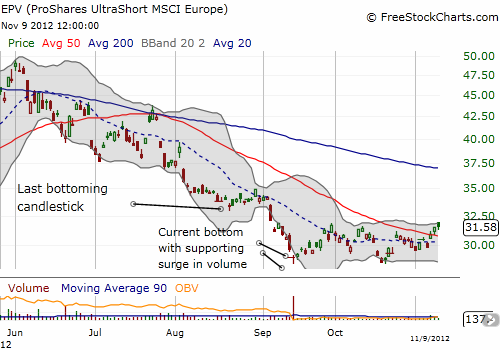
Finally, the economic situation is looking ever more precarious in Europe, independent of concerns here in the U.S. I have stuck by ProShares UltraShort MSCI Europe (EPV) as a hedge since August, even adding to my position. In September, I pointed out that EPV printed what looked like a sustainable bottom. That bottom was retested in October and now EPV has rallied above its 50DMA to the top of its recent range. I am looking for a breakout in the next week. Regardless, I am sticking tightly with this hedge.

Daily T2108 vs the S&P 500

Black line: T2108 (measured on the right); Green line: S&P 500 (for comparative purposes)
Weekly T2108

*All charts created using freestockcharts.com unless otherwise stated
Related links:
The T2108 Resource Page
Expanded daily chart of T2108 versus the S&P 500
Expanded weekly chart of T2108
Be careful out there!
Full disclosure: long SSO calls, long VXX shares and puts, short Australian dollar
