(T2108 measures the percentage of stocks trading above their respective 40-day moving averages [DMAs]. It helps to identify extremes in market sentiment that are highly likely to reverse. To learn more about it, see my T2108 Resource Page. You can follow real-time T2108 commentary on twitter using the #T2108 hashtag. T2108-related trades and other trades are posted on twitter using the #120trade hashtag)
T2108 Status: 34.7%
VIX Status: 19.1
General (Short-term) Trading Call: Hold
Reference Charts (click for view of last 6 months from Stockcharts.com):
S&P 500 or SPY
SDS (ProShares UltraShort S&P500)
U.S. Dollar Index (volatility index)
VIX (volatility index)
VXX (iPath S&P 500 VIX Short-Term Futures ETN)
EWG (iShares MSCI Germany Index Fund)
CAT (Caterpillar)
Commentary
The S&P 500 (SPY) crashed through supports the day after the 2012 Presidential election for a huge 2.4% loss on the day. The critical 200DMA is now just another sell-off day away.
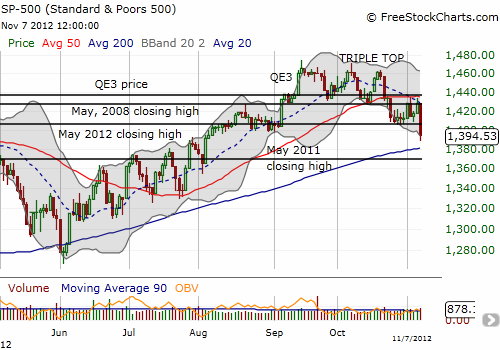
Note that Wednesday’s selling is a rare follow-through that the market has not seen since the dumping going into the June lows. A downtrend is now firmly established with the declining 20DMA, resistance is confirmed at the 50DMA, the triple top is confirmed, and the major breakout from September 6th (I think that was excited anticipation of QE3) is now completely erased. The S&P 500’s triple top and then breakdown of the 50DMA on October 23 planted me biased to the bearish side, but I never acted much on that – and it seemed the right move since the S&P 500 proceeded to do nothing but churn after that. NOW, I smell a major buying opportunity around the corner if/when T2108 drops into oversold territory.
T2108 cratered to 34.7%; its lowest reading since June 25th. Dropping into oversold territory will likely require the S&P 500 to break through support at the 200DMA. Such a move would certainly raise the confidence of bears, but with the market oversold that will be the exact wrong time to scramble into shorts on the market. Thus, a break of 200DMA support could set up a huge bear trap/fakeout. If nothing else, it will certainly be hard to be positive during such a breakdown in the stock market. Assuming I am correct that the market is just in “churn and burn” mode, then sticking with a contrarian attitude will serve me well. Churn and burn also means that the upside potential of playing T2108 oversold will likely be capped by the overhead resistance that is building.
What if this IS the beginning of a major sell-off like the one in May? We cannot know now, but the first major red flag would be the ability of sellers to follow-through on a breakdown from the 200DMA. So, a more conservative T2108 trader could reasonably wait for the S&P 500 to close above the 200DMA before making a bullish trade. I do not want to think too many steps ahead here, but it makes sense under these conditions to make sure I am thinking through bearish possibilities along with bullish ones.
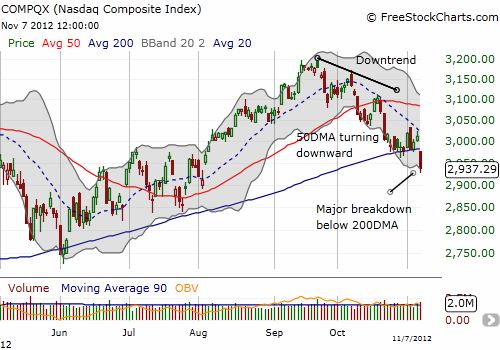
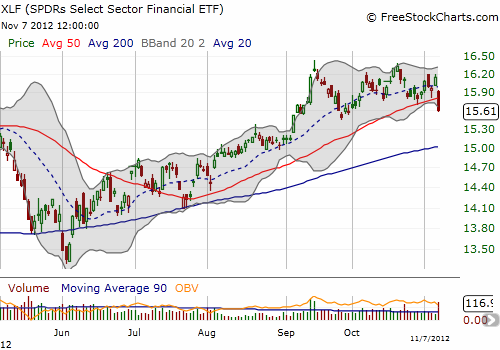
In the last T2108 Update, I noted the stark contrast between the descent and breakdown of the NASDAQ (QQQ) and the ability of financials to maintain their uptrend. Wednesday’s selling generated a solid and bearish breakdown below the 200DMA for the NASDAQ and could provide a lesson and map for how to prepare for what is coming for the S&P 500. The financials in the form of the SPDRS Select Sector Financial ETF (XLF) broke down below its 50DMA but remains much healthier.
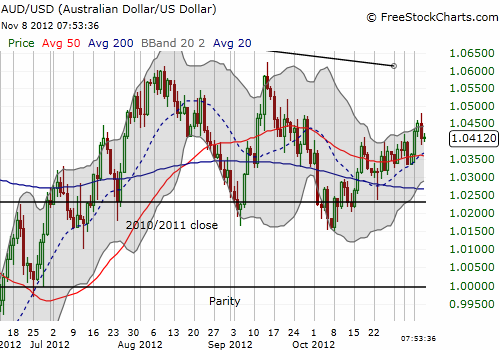
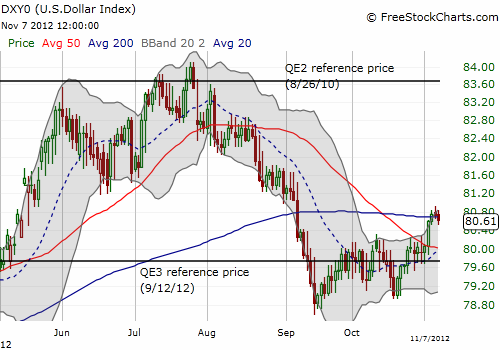
I will close with a positive sign. The Australian dollar (FXA) did not experience a major plunge as our stock market was cratering. In fact, it stayed relatively flat throughout most of the U.S. trading session. I would have expected much more action. The dollar index barely budged either. The currency markets are telling me that Wednesday’s selling was overdone, and I think this is the more telling signal to follow. In fact, I even loaded up on fresh SSO calls because of it (I am hoping to play a quick bounce). Of course, if the dollar does begin a new surge AND the Australian dollar tanks (last night’s very strong employment numbers gave the currency another reprieve), then I will have to give the bearish case a lot more weight. Until/before then, I am looking for Wednesday’s losses on the S&P 500 to get completely reversed within a week or so.
Finally, note well that I am not venturing into circular guessing games to try to connect Wednesday’s selling to the outcome of the Presidential elections or the prospects for the fiscal cliff. (I try to keep it technical here after all!). I WILL say that it is all to easy to forget all the positive momentum that occurred before a sell-off, and it is all too easy to get emotionally swayed when the market does not care about something one day and then suddenly cares a lot the next day. In these situations, the technicals SHOULD provide better guidance than “fundamental” projections and soul-searching about politics. It certainly seems that we will get a test of my claim in the coming weeks, maybe months!
Daily T2108 vs the S&P 500

Black line: T2108 (measured on the right); Green line: S&P 500 (for comparative purposes)
Weekly T2108

*All charts created using freestockcharts.com unless otherwise stated
Related links:
The T2108 Resource Page
Expanded daily chart of T2108 versus the S&P 500
Expanded weekly chart of T2108
Be careful out there!
Full disclosure: long SSO calls, long VXX shares and puts, short Australian dollar
