(T2108 measures the percentage of stocks trading above their respective 40-day moving averages [DMAs]. It helps to identify extremes in market sentiment that are highly likely to reverse. To learn more about it, see my T2108 Resource Page. You can follow real-time T2108 commentary on twitter using the #T2108 hashtag. T2108-related trades and other trades are posted on twitter using the #120trade hashtag)
T2108 Status: 39.4%
VIX Status: 18.8
General (Short-term) Trading Call: Hold (consider closing shorts – bias is bearish)
Reference Charts (click for view of last 6 months from Stockcharts.com):
S&P 500 or SPY
SDS (ProShares UltraShort S&P500)
U.S. Dollar Index (volatility index)
VIX (volatility index)
VXX (iPath S&P 500 VIX Short-Term Futures ETN)
EWG (iShares MSCI Germany Index Fund)
CAT (Caterpillar)
Commentary
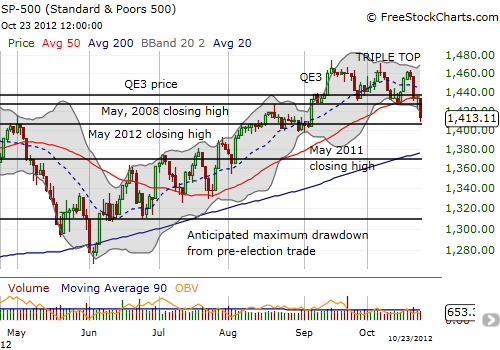
Ben Bernanke will need to do some serious jawboning in today’s statement on monetary policy. Ever since announcing QE3 in mid-September, the U.S. dollar has remained resilient and even gotten stronger, and the stock market has failed to gain traction and even weakened. On Tuesday, the S&P 500 broke down and confirmed a triple top pattern.

In recent T2108 updates, I have downgraded the technical picture from a double top to an ominous triple top. Specifically, in the last update, I warned that the third erasure of QE3 gains is not a charm. The chart above shows that the S&P 500 plunged below critical support at the 50DMA, thus confirming the triple-top. Note well that the rally on September 6th was my last bullish marker before QE3. At the time, I indicated that erasing the gains from that big rally day would be bearish. Regardless, the rally from the June 1st low is technically over as the uptrend is broken by the lower lows produced from the triple top and now the recent breakdown.
My bias now becomes firmly bearish until the S&P 500 either prints a new 52-week high to invalidate the triple top or T2108 drops to oversold territory. In the meantime, I am looking for a Fed-inspired bounce (I added to my bleeding SSO calls for a second and final tranche). However, after that, my bias is to look for opportunities to fade the market and individual stocks. It is a strange position to be in because stocks are about to enter a seasonally strong period.
At the current rate, T2108 could drop to oversold by next week. I would prefer this kind of action because it would allow me to get comfortably bullish again. On Tuesday, T2108 followed the market and plunged 10 percentage points from 49.9%, printing its lowest level since June 26th. An interesting feature of Monday’s trading is that the S&P 500 experienced a strong comeback to close near flatline. BUT, it closed just under the 50DMA, and T2108 created a bearish divergence by dropping 5 percentage points. These bearish divergences do not always correctly signal an imminent reversal in the S&P 500’s fortunes, but I pay close attention to them.
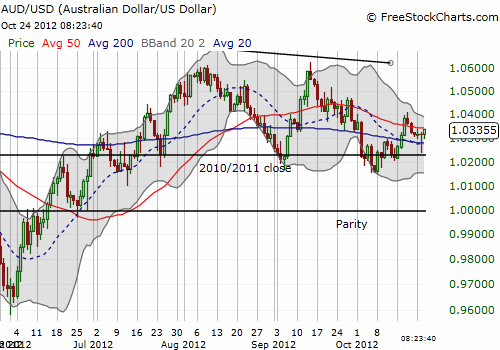
As I type, the Australian dollar is rallying thanks to hotter than expected inflation numbers last night and a firmer than expected PMI number from China. (I will have more to say about these signals in a future post). These are indicative of a strong open for the S&P 500. Thus, the rally may have already begun, and the Fed will get an opportunity to pour more fuel on the fire. Today could be another one of those pivotal days for the market. Stay tuned!

Daily T2108 vs the S&P 500

Black line: T2108 (measured on the right); Green line: S&P 500 (for comparative purposes)
Weekly T2108

*All charts created using freestockcharts.com unless otherwise stated
Related links:
The T2108 Resource Page
Expanded daily chart of T2108 versus the S&P 500
Expanded weekly chart of T2108
Be careful out there!
Full disclosure: long SSO calls
